What Is MACD in Crypto Trading? Explained 2026
— By Tony Rabbit in Tutorials
MACD in crypto explained: learn how traders read crossovers, histogram shifts, and divergence, and why MACD works best as a momentum confirmation tool.
Top results for what is MACD in crypto focus on what the indicator measures, how crossovers and histogram changes are read, and how traders use it for momentum confirmation.
MACD is often used together with moving averages and trend filters. If you want the cleaner companion reads, start with EMA vs SMA in Crypto and then Ichimoku Cloud in Crypto.
MACD is one of the first indicators many crypto traders add to a chart because it looks readable at a glance. Two lines cross, a histogram expands or contracts, and the whole thing seems to promise a clear signal. The truth is more useful than that and less magical: MACD helps describe momentum, but it does not predict the future for you.
Quick answer: MACD in crypto stands for Moving Average Convergence Divergence. It is a momentum indicator built from moving averages that helps traders judge trend strength, momentum shifts, crossovers, zero-line context, and possible divergence. It works best as confirmation around a trade idea, not as the first or only reason to enter.
- MACD measures momentum, not certainty. It organizes what price is already doing, rather than guaranteeing what price will do next.
- The three parts matter together. The MACD line, signal line, and histogram each reveal a different layer of momentum context.
- Crossovers are useful, but often late. A clean crossover can confirm a move, yet many traders misuse it as if it automatically marks the start.
- Divergence is an alert, not a command. It can warn that momentum is fading, but strong trends can ignore it for longer than beginners expect.
- MACD gets much stronger when paired with structure. Support, resistance, trend, and liquidity still matter more than the indicator by itself.
What MACD is and how it is built
MACD stands for Moving Average Convergence Divergence. In plain English, it measures the relationship between a faster moving average and a slower moving average so traders can see whether momentum is strengthening, fading, or shifting direction.
The default MACD settings most traders start with are 12, 26, and 9. That usually means the indicator compares a faster 12-period exponential moving average with a slower 26-period exponential moving average, then smooths the difference with a 9-period signal line. You do not need to memorize the math to use MACD well, but it helps to remember that the indicator is derived from price. It is not showing hidden information that the chart itself does not contain.
MACD line, signal line, and histogram
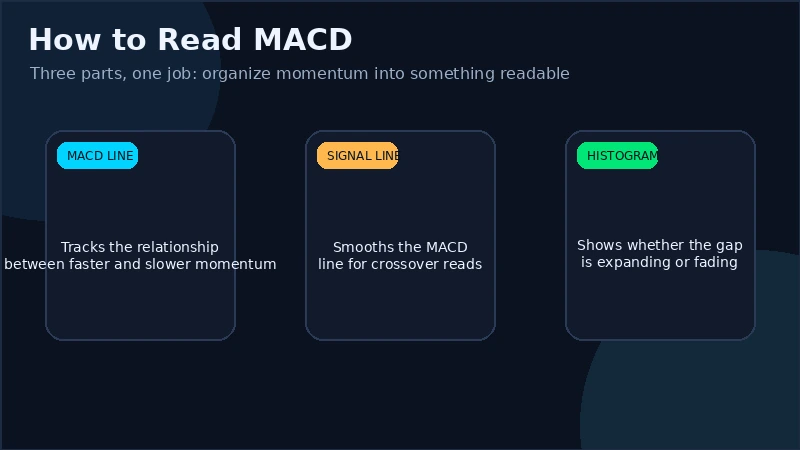
The MACD line is the difference between the faster and slower moving averages. The signal line is a smoothed average of the MACD line. The histogram shows the distance between those two lines. Each piece answers a slightly different question.
| MACD component | What it shows | Why traders care |
|---|---|---|
| MACD line | The relationship between faster and slower momentum | Shows whether momentum is leaning bullish or bearish |
| Signal line | A smoothed version of the MACD line | Used for crossover signals |
| Histogram | The gap between the two lines | Helps show whether momentum is expanding or fading |
Why MACD is useful, and why it always lags
Because MACD is built from moving averages, it is inherently a lagging indicator. That sounds negative, but lag is not a flaw by itself. MACD is useful because it smooths noisy price movement into a cleaner momentum read. The price you pay for that smoothing is delay.
That delay is exactly why traders misuse MACD when they expect it to call exact tops and bottoms. It usually will not. What it can do well is confirm that a move is strengthening, show when momentum is fading, and reveal when price and internal momentum are no longer agreeing.
How to read MACD on crypto charts
The simplest MACD read starts with three checks: are the lines crossing, where is the indicator relative to the zero line, and is the histogram expanding or shrinking? Those three questions usually tell a beginner more than endless settings tweaks.
Bullish and bearish crossovers
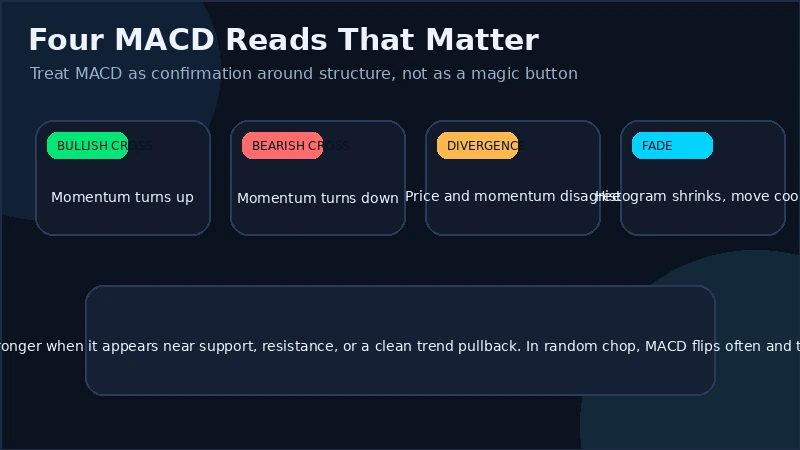
A bullish crossover happens when the MACD line moves above the signal line. A bearish crossover happens when the MACD line falls below it. Traders watch these moments because they can mark a shift in momentum. The catch is timing. A crossover after a long impulsive candle often means the move is already underway, not that it is just beginning.
This is why crossovers work best as confirmation. If price is reclaiming support, breaking a range, or resuming trend after a pullback, a crossover adds confidence. If price is chopping sideways in a weak range, the same crossover may be nothing more than indicator noise.
Why the zero line matters
The zero line helps you judge the backdrop. When MACD is above zero, the faster momentum measure is stronger than the slower one, which usually aligns with bullish trend conditions. When MACD is below zero, bearish momentum has the edge. This does not create a trade on its own, but it changes the quality of the signal.
For example, a bullish crossover above the zero line often supports a continuation setup inside an established uptrend. A bullish crossover far below zero may only represent a temporary bounce inside a larger downtrend. The signal is technically similar, but the context is not.
Histogram expansion and contraction
The histogram is often the most underused part of MACD. Expanding bars suggest the distance between the MACD line and signal line is widening, which can mean momentum is strengthening. Shrinking bars suggest that gap is narrowing, which can mean momentum is slowing even if price is still moving in the same direction.
This makes the histogram useful for both entries and exits. A trader chasing a candle may notice that price is still rising while the histogram is already contracting. That does not automatically mean short, but it does warn that internal momentum is no longer as strong as the visible move makes it look.
MACD divergence in plain English
Divergence is one of the reasons traders love MACD, and one of the reasons beginners misread it. Divergence happens when price makes a new extreme but MACD does not confirm with a matching momentum extreme. It can hint that the current move is losing force.
Bullish divergence
A bullish divergence appears when price makes a lower low, but MACD makes a higher low. In plain terms, price printed a new low, yet the downside momentum was weaker than before. That can signal seller exhaustion.
Imagine ETH sells off into a well-defined support zone, prints a slightly lower swing low, and traders panic because the chart looks worse. If MACD shows a higher low at the same time, momentum is no longer confirming the damage. That does not guarantee a reversal, but it tells you to pay attention to the support reaction instead of assuming the breakdown will continue automatically.
Bearish divergence
A bearish divergence appears when price makes a higher high, but MACD makes a lower high. Price looks stronger on the surface, yet internal momentum is weaker than it was on the prior swing. This often appears late in an extended rally.
For example, BTC may push through a prior local high, trigger breakout excitement, and still show a lower MACD peak than it did on the previous leg. That is not an automatic short signal. It is a warning that upside momentum is not accelerating the way the price chart alone suggests.
Why divergence is useful, but easy to misuse
The biggest mistake with divergence is treating it like a command. Traders see a bearish divergence and short immediately, or see a bullish divergence and buy immediately, even though price has not confirmed anything. Divergence is better viewed as an alert. It tells you to watch structure more closely, tighten the logic of the trade, and look for confirmation from support, resistance, volume, or trend breaks.
Strong crypto trends can ignore divergence for a long time. A market can become less healthy internally and still continue higher or lower because momentum stays one-sided. That is why divergence works best near meaningful levels, not in the middle of nowhere.
MACD setups traders actually use
MACD becomes practical when attached to real market situations instead of treated like a standalone gadget.
Trend-continuation pullbacks
One common use is a pullback inside an existing trend. Price trends up, retraces into a support zone, then MACD turns back up or prints a bullish crossover while price reclaims the level. Here, MACD is not inventing the setup. It is confirming that momentum is re-aligning with the trend.
Range breaks with momentum confirmation
Another useful setup is a range breakout where price is leaving a clear consolidation and MACD expands in the same direction. The key is that the level matters first. If a market breaks a well-defined range, reclaims it, and MACD confirms with stronger momentum, the signal has more weight than a random crossover in the middle of a choppy chart.
Managing winners when momentum starts to fade
MACD is not only an entry tool. It can also help with trade management. If you are already long and price continues drifting higher while the histogram is shrinking and the MACD line starts flattening, that can be a cue to tighten stops, take partial profit, or at least stop adding aggressively.
Common MACD misuse and false signals
Most MACD problems come from forcing the indicator to do a job it was never designed to do.
- Taking every crossover: in sideways markets, MACD can flip repeatedly and generate a series of low-quality signals.
- Using it on noisy lower timeframes without context: one-minute and five-minute charts can make MACD look active while telling you almost nothing durable.
- Treating divergence like an instant reversal order: divergence only says momentum is no longer confirming price, not that price must reverse now.
- Ignoring liquidity and token quality: a clean MACD setup on a thin or manipulated pair is still a weak setup.
- Over-optimizing settings: changing the indicator until it fits the last chart often creates false confidence rather than better signals.
The clean rule is simple: structure first, indicator second. If the chart has no obvious thesis, MACD should not be asked to invent one.
What settings and timeframes work best
The default 12, 26, and 9 settings are common for a reason. They are widely understood, widely tested, and usually good enough for learning the indicator. They are not magical, but they provide a stable starting point.
Timeframe matters at least as much as settings. Many traders find MACD cleaner on higher timeframes such as the four-hour, daily, or weekly chart because there is less random noise. On very low timeframes, MACD can still help with execution, but the user needs to know that the signal quality drops and the churn increases.
Custom settings only make sense when they are part of a tested process. Tweaking MACD because the current chart looks messy is usually a sign that the trader is trying to force clarity out of an unclear market.
Practical workflow for DEXTools and TradingView users
The best workflow is simple. Use DEXTools first to decide which pairs deserve attention at all. Check liquidity, recent volume, and whether the market is orderly enough to respect technical levels. Then move to TradingView or your charting tool and mark support, resistance, and trend context. Only after that should MACD enter the picture.
- Build a watchlist of liquid, readable pairs. Good indicator work starts with markets that are capable of respecting structure.
- Mark key levels before looking at the indicator. The level matters more than the crossover.
- Use MACD as confirmation. Ask whether momentum supports the level test, pullback, or breakout you already identified.
- Check companion tools when needed. RSI, support and resistance, and volume profile can clarify whether a signal is meaningful or late.
If you need broader indicator setup help, hand readers to how to use TradingView indicators for crypto instead of turning this article into a platform tutorial.
MACD vs RSI in one short comparison
MACD and RSI often appear together because they answer different questions. MACD is usually stronger for momentum shifts and trend continuation context. RSI is often cleaner for momentum extremes and overbought or oversold conditions. Neither replaces structure, and neither needs to do the other indicator's job.
| Indicator | Usually stronger for | Main caution |
|---|---|---|
| MACD | Momentum shifts, trend continuation, crossovers | Can lag and become late in fast moves |
| RSI | Overbought and oversold context, momentum extremes | Can stay extreme during strong trends |
Frequently asked questions
What does MACD stand for in crypto trading?
MACD stands for Moving Average Convergence Divergence. It is a momentum indicator built from moving averages, and traders use it to read shifts in speed and trend quality.
Is MACD a good indicator for crypto beginners?
Yes, if beginners treat it as confirmation rather than as a standalone signal engine. It is readable, but it still needs chart structure and liquidity context.
What MACD settings work best for crypto?
The default 12, 26, and 9 settings are the most common starting point. They are not perfect for every trader, but they are usually the right place to learn the indicator before testing variations.
Is MACD better than RSI for crypto trading?
Not universally. MACD is often stronger for momentum shifts and continuation reads, while RSI is often cleaner for momentum extremes and overbought or oversold context.
Which timeframe is best for MACD in crypto?
There is no single best timeframe, but many traders find MACD cleaner on higher timeframes than on very noisy lower ones. The more random the chart, the more carefully the signals should be treated.
Final takeaway: MACD is useful because it makes momentum visible and repeatable. It becomes dangerous only when traders ask it to do the full job alone. Use structure first, use MACD second, and let the indicator confirm a trade instead of inventing one.
Disclaimer: This draft is for educational purposes only and does not constitute investment, financial, legal, or trading advice. Indicators can improve context, but they do not remove risk.
Related Guides
- What Is Wash Trading in Crypto? Complete Beginner Guide (2026)
- Wash Trading Red Flags on Exchanges and DEXs (2026)
- What Is Trading Volume in Crypto? How to Read It (2026)
- What Is the Supertrend Indicator in Crypto Trading? 2026 Guide
- What Is the Keltner Channel in Crypto Trading? 2026 Guide
Frequently Asked Questions
What is MACD in crypto trading?
MACD, which stands for Moving Average Convergence Divergence, is a momentum indicator built from the relationship between two moving averages of price. Traders use it to gauge the strength and direction of a trend.
How do traders read MACD crossovers?
A crossover happens when the MACD line crosses its signal line, which some traders interpret as a potential shift in momentum. These signals are not guarantees and are often used together with other tools and context.
What is MACD divergence?
Divergence occurs when price moves in one direction while the MACD moves in the other, which some traders see as a possible sign that momentum is weakening. It is treated as a warning to investigate further rather than a definite reversal.
Is MACD reliable on its own?
MACD works best as a confirmation tool rather than a standalone signal, because it can give false readings in choppy or sideways markets. Many traders combine it with price action and other indicators to reduce the chance of being misled.