What Is Ichimoku Cloud in Crypto? 5 Lines Explained (2026)
— By Tony Rabbit in Tutorials

What is Ichimoku Cloud in crypto? Learn the 5 lines, TK cross setups and why Ichimoku is a full trend system, not just a moving-average comparison.
This page explains Ichimoku as a full trading system. If you only want a moving-average comparison focused on lag, smoothing, and crossover behavior, read our EMA vs SMA guide.
The Ichimoku Cloud looks intimidating the first time a trader sees it. Five lines, a colored area between two of them, and Japanese names that mean nothing in English. Most beginners turn it off. The traders who keep it on discover something useful: Ichimoku is a complete trend system on a single chart, not just another indicator. Once the components click, it becomes one of the cleanest visual ways to read crypto trend, momentum, and structure at the same time.
Quick answer: Ichimoku Kinko Hyo (often shortened to Ichimoku Cloud) is a Japanese technical analysis system that combines five plotted lines to give a trader a snapshot of trend, momentum, and support/resistance in one view. The five components are Tenkan-sen, Kijun-sen, Senkou Span A, Senkou Span B (which form the cloud or Kumo), and Chikou Span. Price above a green cloud is bullish, price below a red cloud is bearish, and the lines inside provide entries and confirmation.
- Ichimoku is a system, not a single line. Five components together describe trend, momentum, and structure.
- The cloud is the regime filter. Above green = bullish, below red = bearish, inside = no-trade zone.
- The Tenkan/Kijun cross is the main entry signal. Stronger when it happens above or below the cloud.
- Chikou Span confirms structure. The lagging line should agree with the trend before a setup is taken.
- Default settings (9, 26, 52) work fine on crypto majors. Custom periods are usually a way to overfit recent moves.
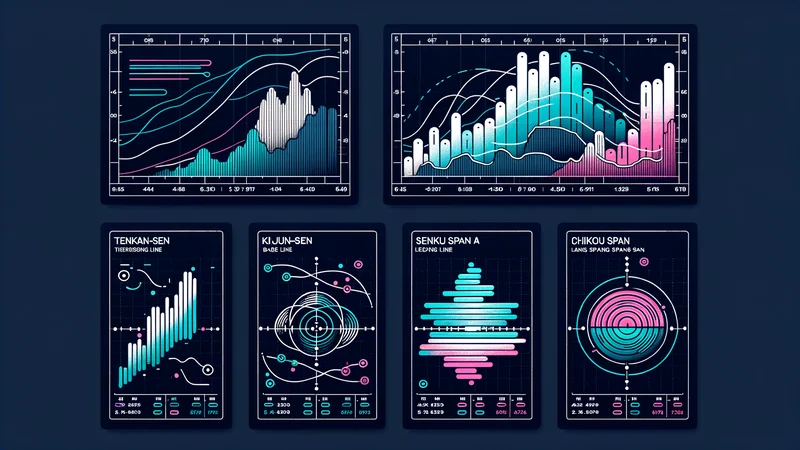
The five Ichimoku components, in plain English
Ichimoku has five lines. Each one answers a different question. Memorizing the names matters less than understanding what each component is telling you.
Tenkan-sen (Conversion Line)
The Tenkan-sen averages the highest high and the lowest low of the last 9 periods, then divides by 2. It is the fastest line on the chart. Treat it as a short-term momentum reference: when price holds above the Tenkan, short-term momentum is bullish; when price loses it on the close, short-term momentum has shifted.
Kijun-sen (Base Line)
The Kijun-sen does the same calculation as the Tenkan but over 26 periods. It is the medium-term anchor. The Kijun acts as dynamic support and resistance and often catches pullbacks in trending crypto markets. When the Kijun is flat, the market is consolidating; when it is rising or falling, the trend is committed.
Senkou Span A and B (the Cloud edges)
The cloud (Kumo) is formed by two lines projected 26 periods into the future. Senkou Span A is the average of Tenkan and Kijun. Senkou Span B is the highest high and lowest low of the last 52 periods, divided by 2. The space between them is the cloud, colored green when Span A is above Span B, red when reversed. The cloud is the most important part of the system: it acts as forward-projected support and resistance.
Chikou Span (Lagging Line)
The Chikou Span is the current close plotted 26 periods in the past. Its job is to confirm trend strength: if the Chikou is above price 26 periods ago, the trend is healthy. If the Chikou tangles with old price action, the trend is conflicted.
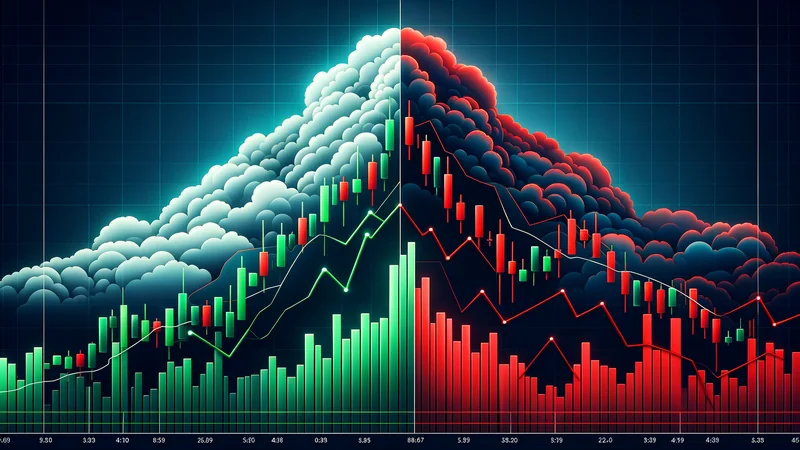
How to read the cloud (Kumo)
The cloud is the Ichimoku feature most traders see first and rely on most. It compresses trend and projected support/resistance into a single visual zone. Reading it well is the difference between casual Ichimoku users and ones who take real edges from the system.
Price above a green cloud
This is the bullish baseline. Price is above forward-projected support, the trend bias is up, and pullbacks toward the cloud often offer continuation entries. The deeper the cloud, the stronger the implied support.
Price below a red cloud
The mirror image. Price is below forward-projected resistance, trend bias is down, and rallies into the cloud are typical short setups in continued downtrends. Strong downtrends often respect the cloud as resistance for weeks.
Price inside the cloud
This is the no-trade zone. Inside the cloud, the trend is undefined and signals from other Ichimoku components become much weaker. Many disciplined Ichimoku traders simply step aside when price is inside the Kumo.
The classic Ichimoku signals
Ichimoku is generous with signals because it has five components. The trader's job is to filter, not to chase every cross.
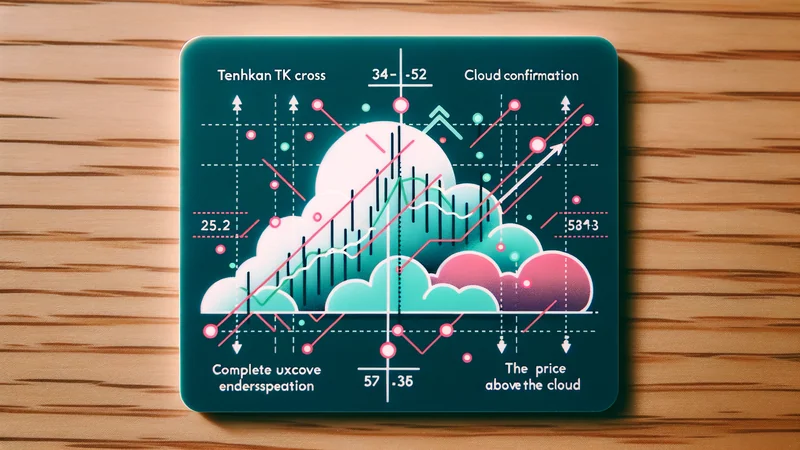
The TK Cross (Tenkan/Kijun cross)
The most discussed Ichimoku signal. A bullish TK cross happens when the Tenkan crosses above the Kijun. A bearish TK cross is the reverse. Quality matters more than the cross itself: a TK cross above the cloud is much stronger than one inside it, and a TK cross below the cloud is much stronger than one inside it.
The Kumo Breakout
When price closes decisively above or below the cloud after a long consolidation, the implied trend has shifted. Kumo breakouts are slow signals (the cloud is thick on purpose), but they tend to align with sustained moves rather than short squeezes. Many trend traders use Kumo breakouts as their primary regime trigger and ignore most TK crosses inside the cloud.
Chikou Span confirmation
Before taking any Ichimoku setup, check the Chikou Span. If it is above price 26 periods ago in a long setup, the trend is confirmed. If the Chikou is tangled with old candles, the setup has structural conflict and the trade has lower expectancy. The Chikou is the "second opinion" of the system.
Default settings and why they matter
Ichimoku's default settings (9, 26, 52, with the lagging projection at 26 periods) come from the original Japanese system designed for daily charts in markets that traded six days a week. They have aged surprisingly well, and the most important reason is consistency: enough traders use the defaults that the cloud becomes a real, observed level on the major crypto pairs.
Should you change the settings?
Most traders should not. Tweaking Ichimoku to (5, 20, 40) or any other ratio is usually a sign that someone is curve-fitting recent price action. The defaults are not magic, but they are the version other traders are watching, which is part of why they work.
Crypto-specific adjustments
Some crypto traders use (10, 30, 60) or (20, 60, 120) on lower timeframes because crypto trades 24/7, with no weekend gaps. Both are reasonable, but only after the trader has fluency with the defaults. Changing settings before understanding the system is a way to hide poor execution behind tweaks.
How to grade Ichimoku signal quality
| Setup | Quality | Why |
|---|---|---|
| TK cross above cloud + Chikou clear | A grade | All three components agree with the trend. |
| Kumo breakout with strong candle close + volume | A grade | Major regime shift confirmed by price action. |
| TK cross inside the cloud | C grade | Trend undefined; high false-signal rate. |
| Kumo twist while price is inside cloud | C grade | Major change implied but no confirmation yet. |
| TK cross against the cloud direction | D grade | Counter-trend signal with low expectancy. |
Common Ichimoku mistakes
- Trading every TK cross. Most fail unless they happen on the correct side of the cloud.
- Ignoring the Chikou Span. The lagging line is a free filter that catches structural conflicts.
- Hiding the cloud because it looks ugly. The cloud is the system, not decoration.
- Trading inside the Kumo. The cloud zone is purposely defined as the "wait" area.
- Combining Ichimoku with too many other indicators. Ichimoku is already a complete system; piling on RSI, MACD, and three moving averages adds confusion, not edge.
An Ichimoku workflow that holds up
- Start on the daily. Identify whether price is above, below, or inside the cloud.
- Check the Chikou Span. Confirm the lagging line agrees with the directional bias.
- Drop to the 4-hour for execution. Look for TK crosses on the correct side of the daily cloud.
- Combine with structure. Pair the system with chart patterns and key support/resistance.
- Use companion tools sparingly. RSI for momentum extremes and volume profile for liquidity context, not as overlays inside Ichimoku.
Frequently asked questions
Is Ichimoku Cloud good for crypto?
Yes, especially on liquid pairs and on the 4-hour, daily, and weekly timeframes. Ichimoku rewards markets that respect levels, and crypto majors do that more often than illiquid altcoins. On thin or whale-driven pairs, Ichimoku signals can break down like any other technical system.
What are the default Ichimoku settings?
The original defaults are 9 (Tenkan), 26 (Kijun), 52 (Senkou Span B), with the Chikou Span and cloud projection both at 26. They work well across most major crypto pairs without modification.
Can Ichimoku be used alone?
It can, because it is already a complete system covering trend, momentum, and support/resistance. That said, most professional Ichimoku traders still confirm setups with structure (key levels, prior swing highs/lows) and basic execution sanity checks like volume.
What is a Kumo breakout?
A Kumo breakout is when price closes decisively above or below the Ichimoku cloud after a period inside it. It signals a regime shift and is one of the strongest single Ichimoku signals, especially when paired with Chikou confirmation and volume expansion.
Is Ichimoku Cloud a leading or lagging indicator?
It is mixed. The cloud (Senkou Spans) is projected forward, which makes it a leading reference for support and resistance. The other components are lagging, like most moving-average-based indicators. The mix is part of why Ichimoku feels different from simpler systems.
Final takeaway: Ichimoku Cloud is not a magic chart. It is a complete trend system that, when used with discipline, replaces a stack of indicators with a single visual framework. Treat the cloud as a regime filter, the TK cross as an entry trigger, and the Chikou as a structural confirmation, and the system pays off on trending crypto majors.
Disclaimer: This guide is for educational purposes only and does not constitute investment, financial, legal, or trading advice. Indicator-based systems can improve context but do not eliminate market risk.
Related Guides
- What Is IPFS: Complete InterPlanetary File System Guide (2026)
- What Is Akash Network? DePIN Cloud & AKT Guide 2026
- What is Akash Network (AKT)? Decentralized Cloud Guide
- What Is Aethir (ATH)? The Decentralized GPU Cloud Powering AI and Gaming in 2026
- DePIN vs. Traditional Cloud: Cost, Reliability, and Risks
Frequently Asked Questions
What is the Ichimoku Cloud in crypto?
The Ichimoku Cloud is a technical analysis system that uses several lines to show trend, momentum, and support and resistance at a glance. It is designed as a complete framework rather than a single indicator.
What are the 5 lines of Ichimoku?
The five components are the Tenkan sen, Kijun sen, Senkou Span A, Senkou Span B, and the Chikou Span. The two Senkou spans form the cloud, while the others help gauge short term momentum and trend direction.
What is a TK cross in Ichimoku?
A TK cross occurs when the Tenkan sen crosses the Kijun sen, which some traders interpret as a momentum or trend signal. Its reliability often depends on whether price is above or below the cloud.
Why is Ichimoku considered a full trend system?
Unlike a single moving average, Ichimoku combines multiple lines and the cloud to assess trend, momentum, and key levels together. This lets traders read direction and potential support or resistance from one chart view.