How to Use Volume Profile in Crypto on TradingView
— By Tony Rabbit in Tutorials

Use Volume Profile in crypto on TradingView: learn setup steps, anchored ranges, POC and value area workflows, and execution ideas for real charts.
Volume Profile becomes far more useful when you stop treating it like a mysterious side graphic and start reading it as a map of acceptance. The whole point is to see where the market did business by price, not just by time. That is why profile tools are so valuable on TradingView. They let you see where the market was comfortable, where it rushed, and where future reactions may matter more.
Intent check: This page is the hands-on TradingView tutorial for volume profile. If you want the concept-level explainer for POC, value area, HVN, and LVN first, read Volume Profile in Crypto Explained.
This tutorial is about using volume profile in practice. Not just memorizing the definition, but actually finding the tool on TradingView and reading the output in a way that makes sense on a crypto chart.
Quick take
- Use the TradingView Indicators menu to search Volume Profile tools.
- Start by understanding POC, value area, HVN, and LVN.
- Volume Profile helps explain where the market accepted price and where it moved through thin areas.
- It works best with price structure, not as a standalone prediction engine.
How to Add Volume Profile on TradingView
Open your TradingView chart, click Indicators, and search for volume profile. TradingView offers multiple built-in versions, which is useful because each one answers a slightly different question.
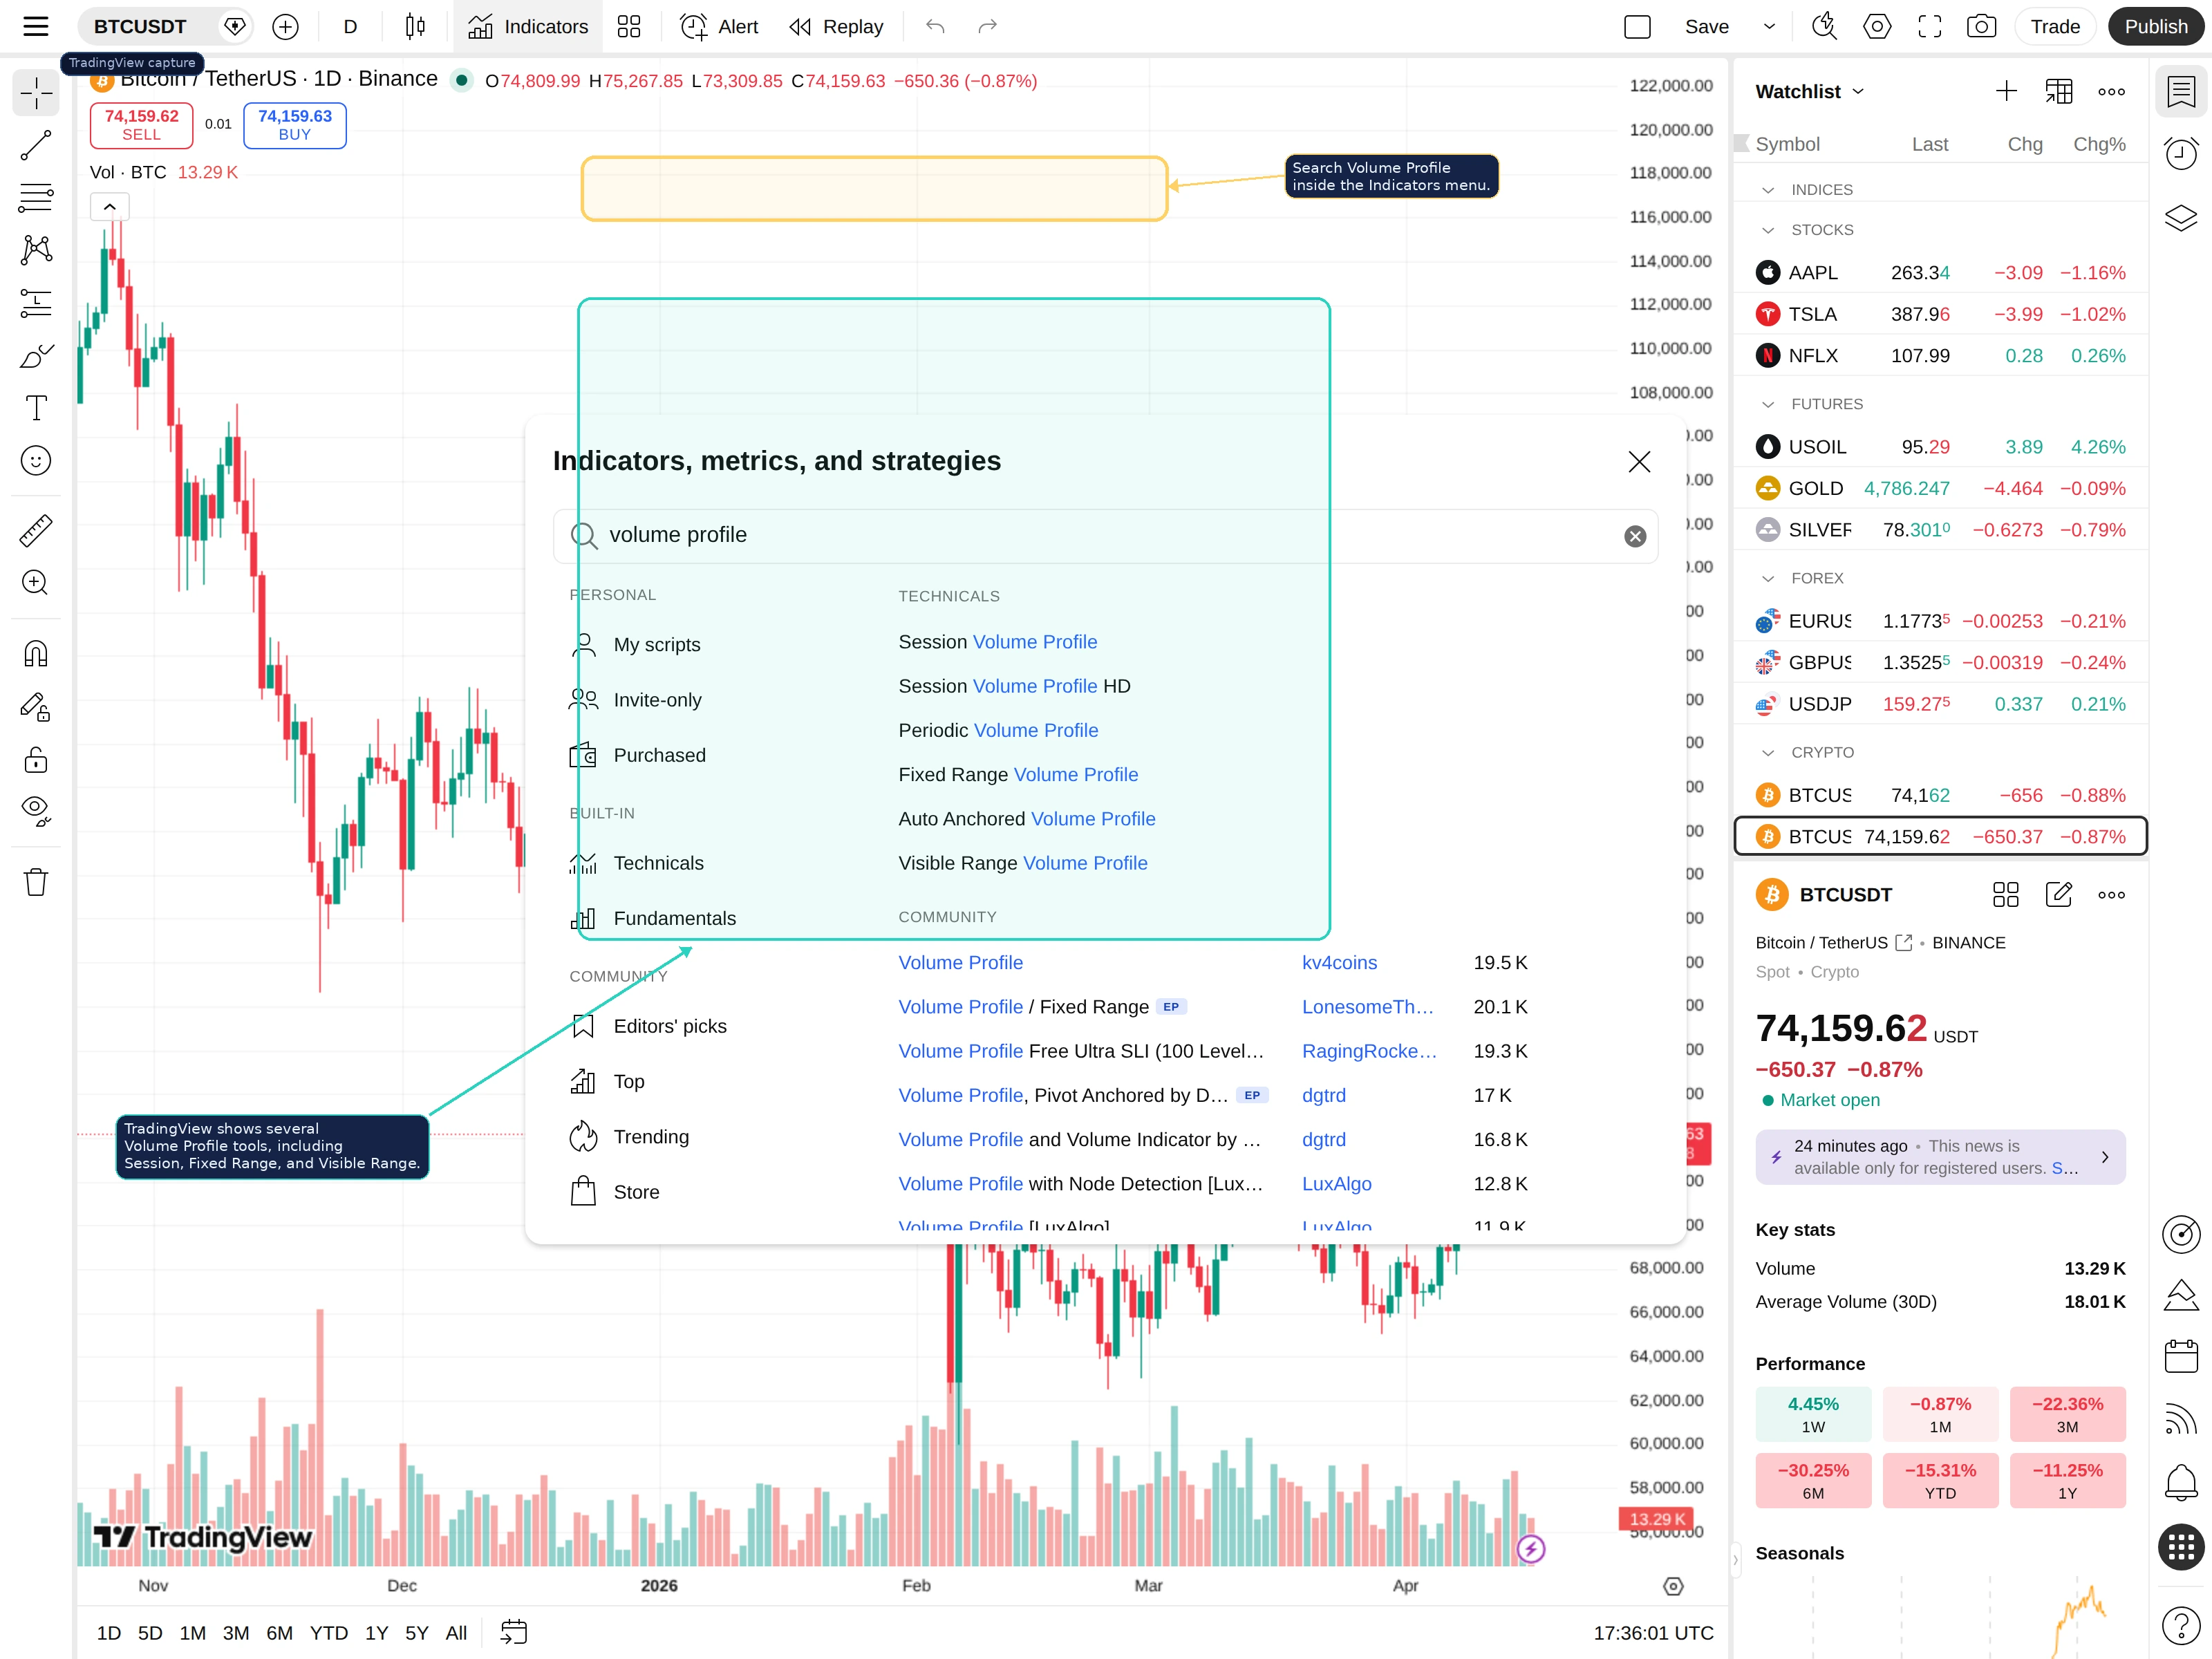
Here is the practical rule:
- Session Volume Profile: useful for daily or intraday context.
- Visible Range Volume Profile: useful when you want the profile to adapt to what is currently on screen.
- Fixed Range Volume Profile: useful when you want to study one specific move, range, or event leg.
If you are new, start with one version and learn how the output behaves before jumping between all of them.
What to Look at First: POC and Value Area
The first thing to learn is the relationship between the point of control and the value area. These two features do most of the work for beginners.
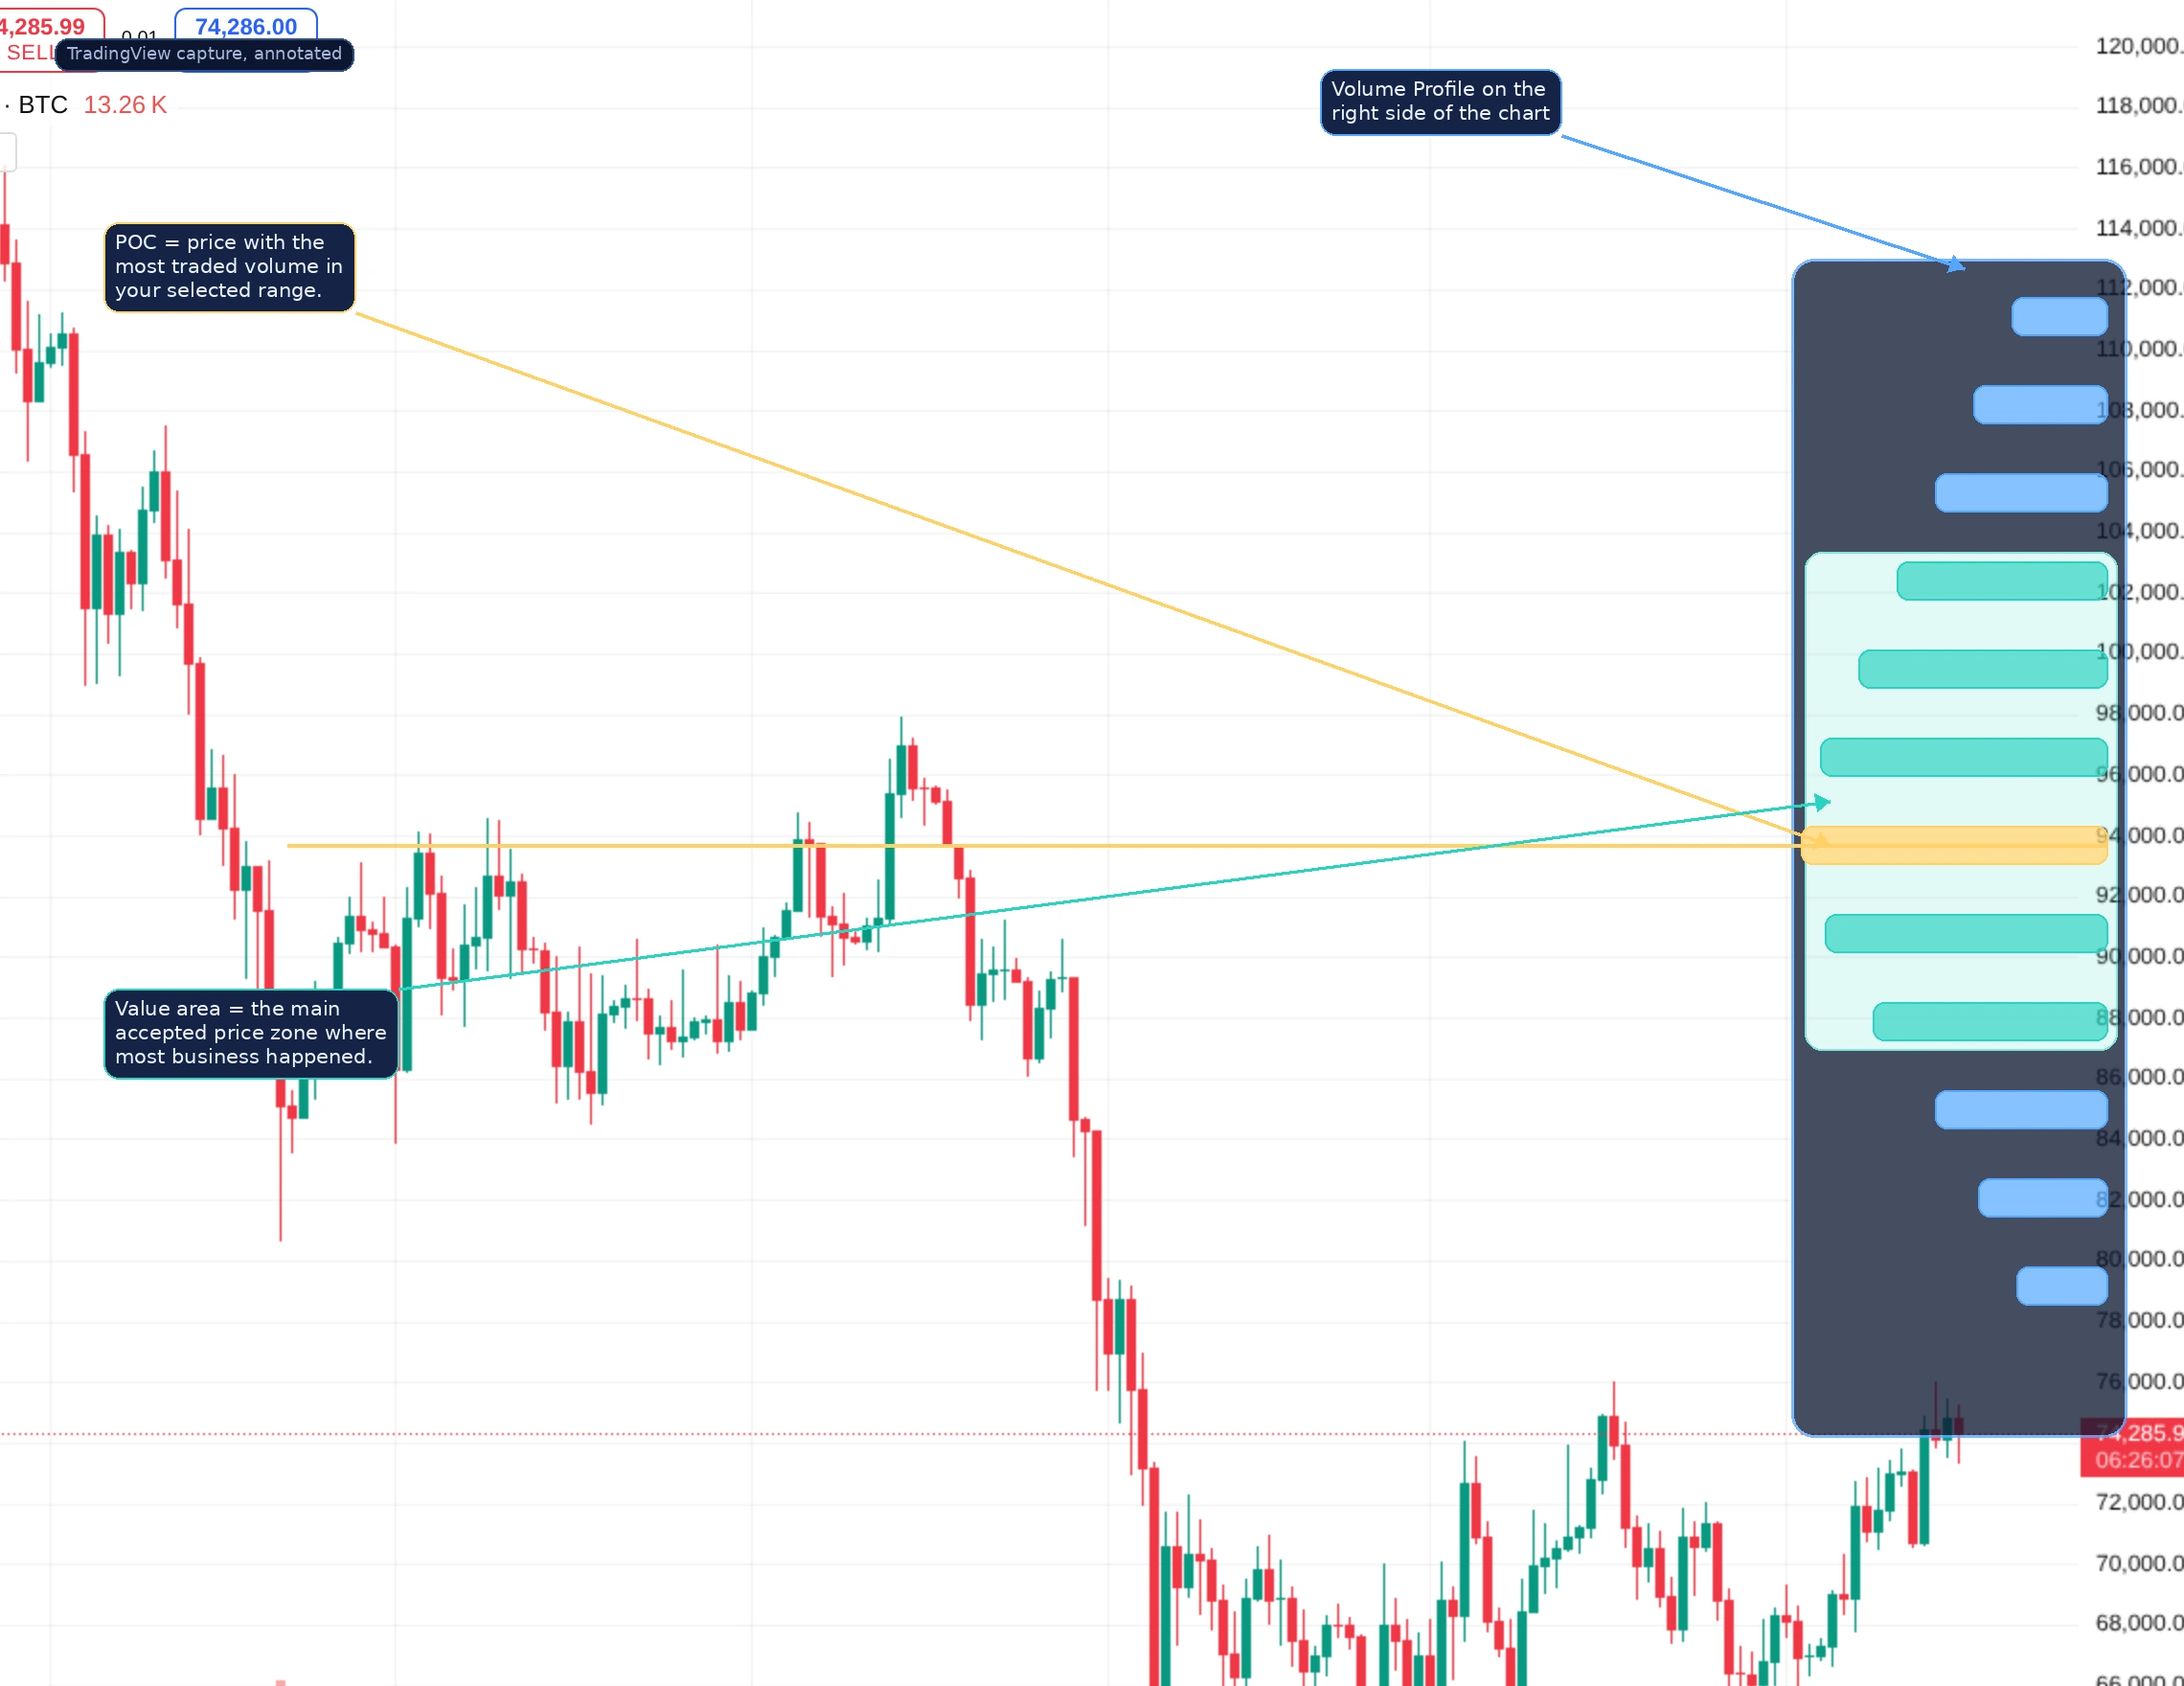
POC is the price where the most volume traded in the measured range. Value area is the main accepted band where most of the business took place around that point. When price is trading inside or around this accepted zone, the market is interacting with prices it previously considered fair. When price is far outside it, traders start asking whether the move is being accepted or rejected.
How HVN and LVN Change the Read
Once you understand POC and value area, the next step is learning HVNs and LVNs.
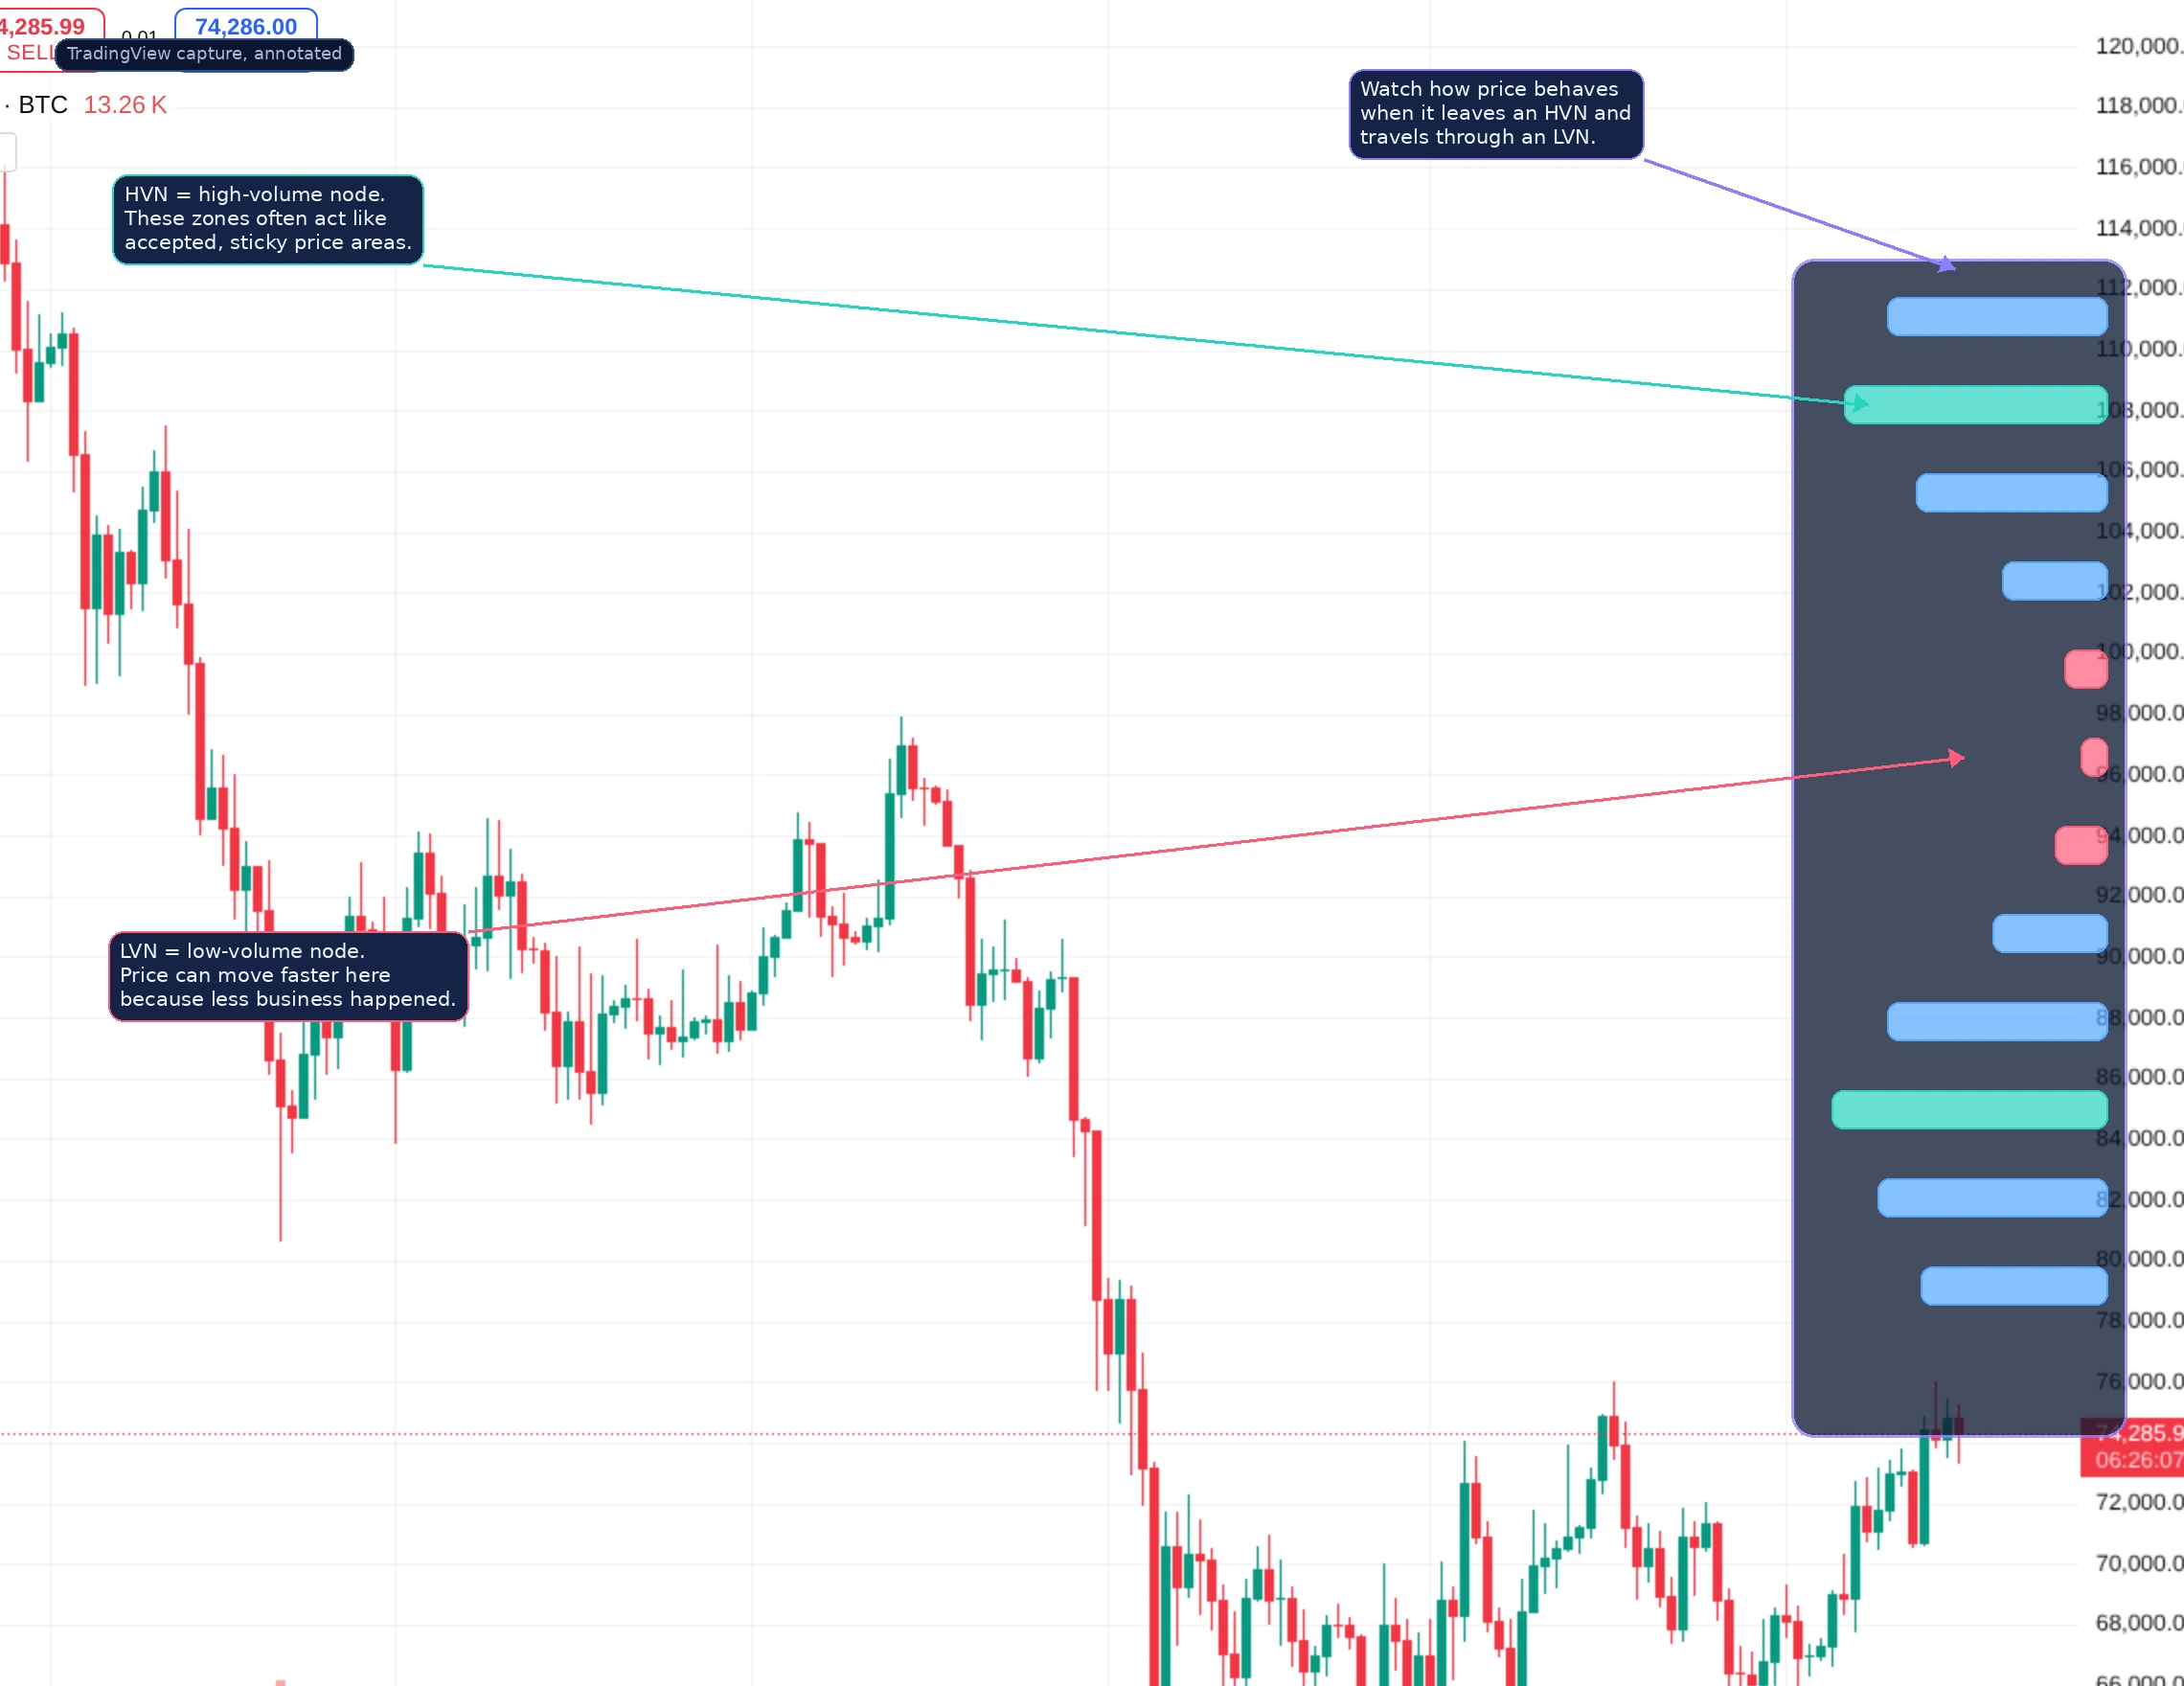
HVNs are high-volume nodes. They show prices where the market spent real effort and accepted value. LVNs are low-volume nodes. They show thinner zones where less business happened, which often means price can move through them faster on a revisit.
This is one of the biggest reasons traders use Volume Profile. It helps explain why some price zones feel sticky while others behave like thin air.
How to Use Volume Profile Step by Step
- Start with a clean chart and mark the obvious structure first.
- Add one Volume Profile tool on TradingView.
- Identify the POC and the main value area.
- Notice where the biggest HVNs and clearest LVNs sit.
- Watch how price reacts when revisiting those areas.
The goal is not to predict every turn. The goal is to understand where the market previously accepted price and where it did not.
When Volume Profile Works Best
Volume Profile is especially useful in these situations:
- After a large impulsive move when you want to study where business actually concentrated.
- Inside ranges when you want to see the main accepted zone.
- During revisits to prior balance areas.
- When comparing acceptance versus rejection around a key market level.
It is less useful when traders try to turn every little bar in the profile into a hard prediction. The tool is strongest as structure context, not as a magic signal generator.
Volume Profile vs Anchored VWAP
Volume Profile and anchored VWAP often work well together, but they are not interchangeable. Volume Profile maps where business happened across price. Anchored VWAP tracks the average traded price since a chosen event. Profile is about acceptance across price levels. Anchored VWAP is about average position since an anchor.
Common Volume Profile Mistakes
- Using too many profiles at once. This quickly turns the chart unreadable.
- Ignoring the selected range. The range you measure changes the result.
- Treating every node as a trade signal. Context still matters.
- Skipping price action. The profile is strongest when paired with real chart structure.
Frequently Asked Questions
How do you add Volume Profile on TradingView?
Open Indicators, search volume profile, and choose the built-in version that fits the chart question you are asking.
What is POC in volume profile?
POC means point of control, the price level with the highest traded volume in the selected range.
What is the value area?
The value area is the main accepted price band where most of the traded volume occurred.
What are HVN and LVN?
HVN means high-volume node and LVN means low-volume node. HVNs often mark accepted zones, while LVNs often mark thinner zones where price may move faster.
Related reading
Disclaimer: This article is for educational purposes only and does not constitute investment, financial, legal, or trading advice. Volume Profile is a context tool, not a guarantee.
Related Guides
- Volume Profile in Crypto Explained: POC, Value Area, HVN and LVN (2026)
- How to Use TradingView Indicators for Crypto: Beginner Setup Guide (2026)
- How to Use Banana Gun on Ethereum and Solana: Setup, Sniping and Safe Execution (2026)
- How to Use TradingView for Crypto: Complete Charting Tutorial 2026
- Wash Trading Red Flags on Exchanges and DEXs (2026)