How to Use TradingView Indicators for Crypto: Beginner Setup Guide (2026)
— By Tony Rabbit in Tutorials
Learn how to use TradingView indicators for crypto with real platform captures, a clean beginner setup, and practical rules for choosing indicators without cluttering the chart.
TradingView is powerful, but most beginners make the same mistake the moment they open it. They start adding indicators before they can even read the chart. A clean setup turns TradingView into a serious analysis tool. A cluttered setup turns it into a glowing mess of lagging signals.
The right way to use TradingView indicators in crypto is simple: start with the chart, add only what answers a real question, and keep the workspace readable. Indicators should help you see trend, momentum, volatility, or participation. They should not replace thinking.
Quick take
- Use TradingView indicators to answer specific questions, not to decorate the chart.
- Start with a small stack: trend, momentum, and participation or context.
- Use the Indicators button in the top toolbar to search and add built-in tools.
- If the chart becomes harder to read after adding indicators, the setup is getting worse, not better.
Where TradingView Indicators Are Added
The platform makes this easy once you know where to look. Open a chart, then use the Indicators button in the top toolbar. This opens the indicator library, where you can search built-in indicators, community scripts, and strategy tools.
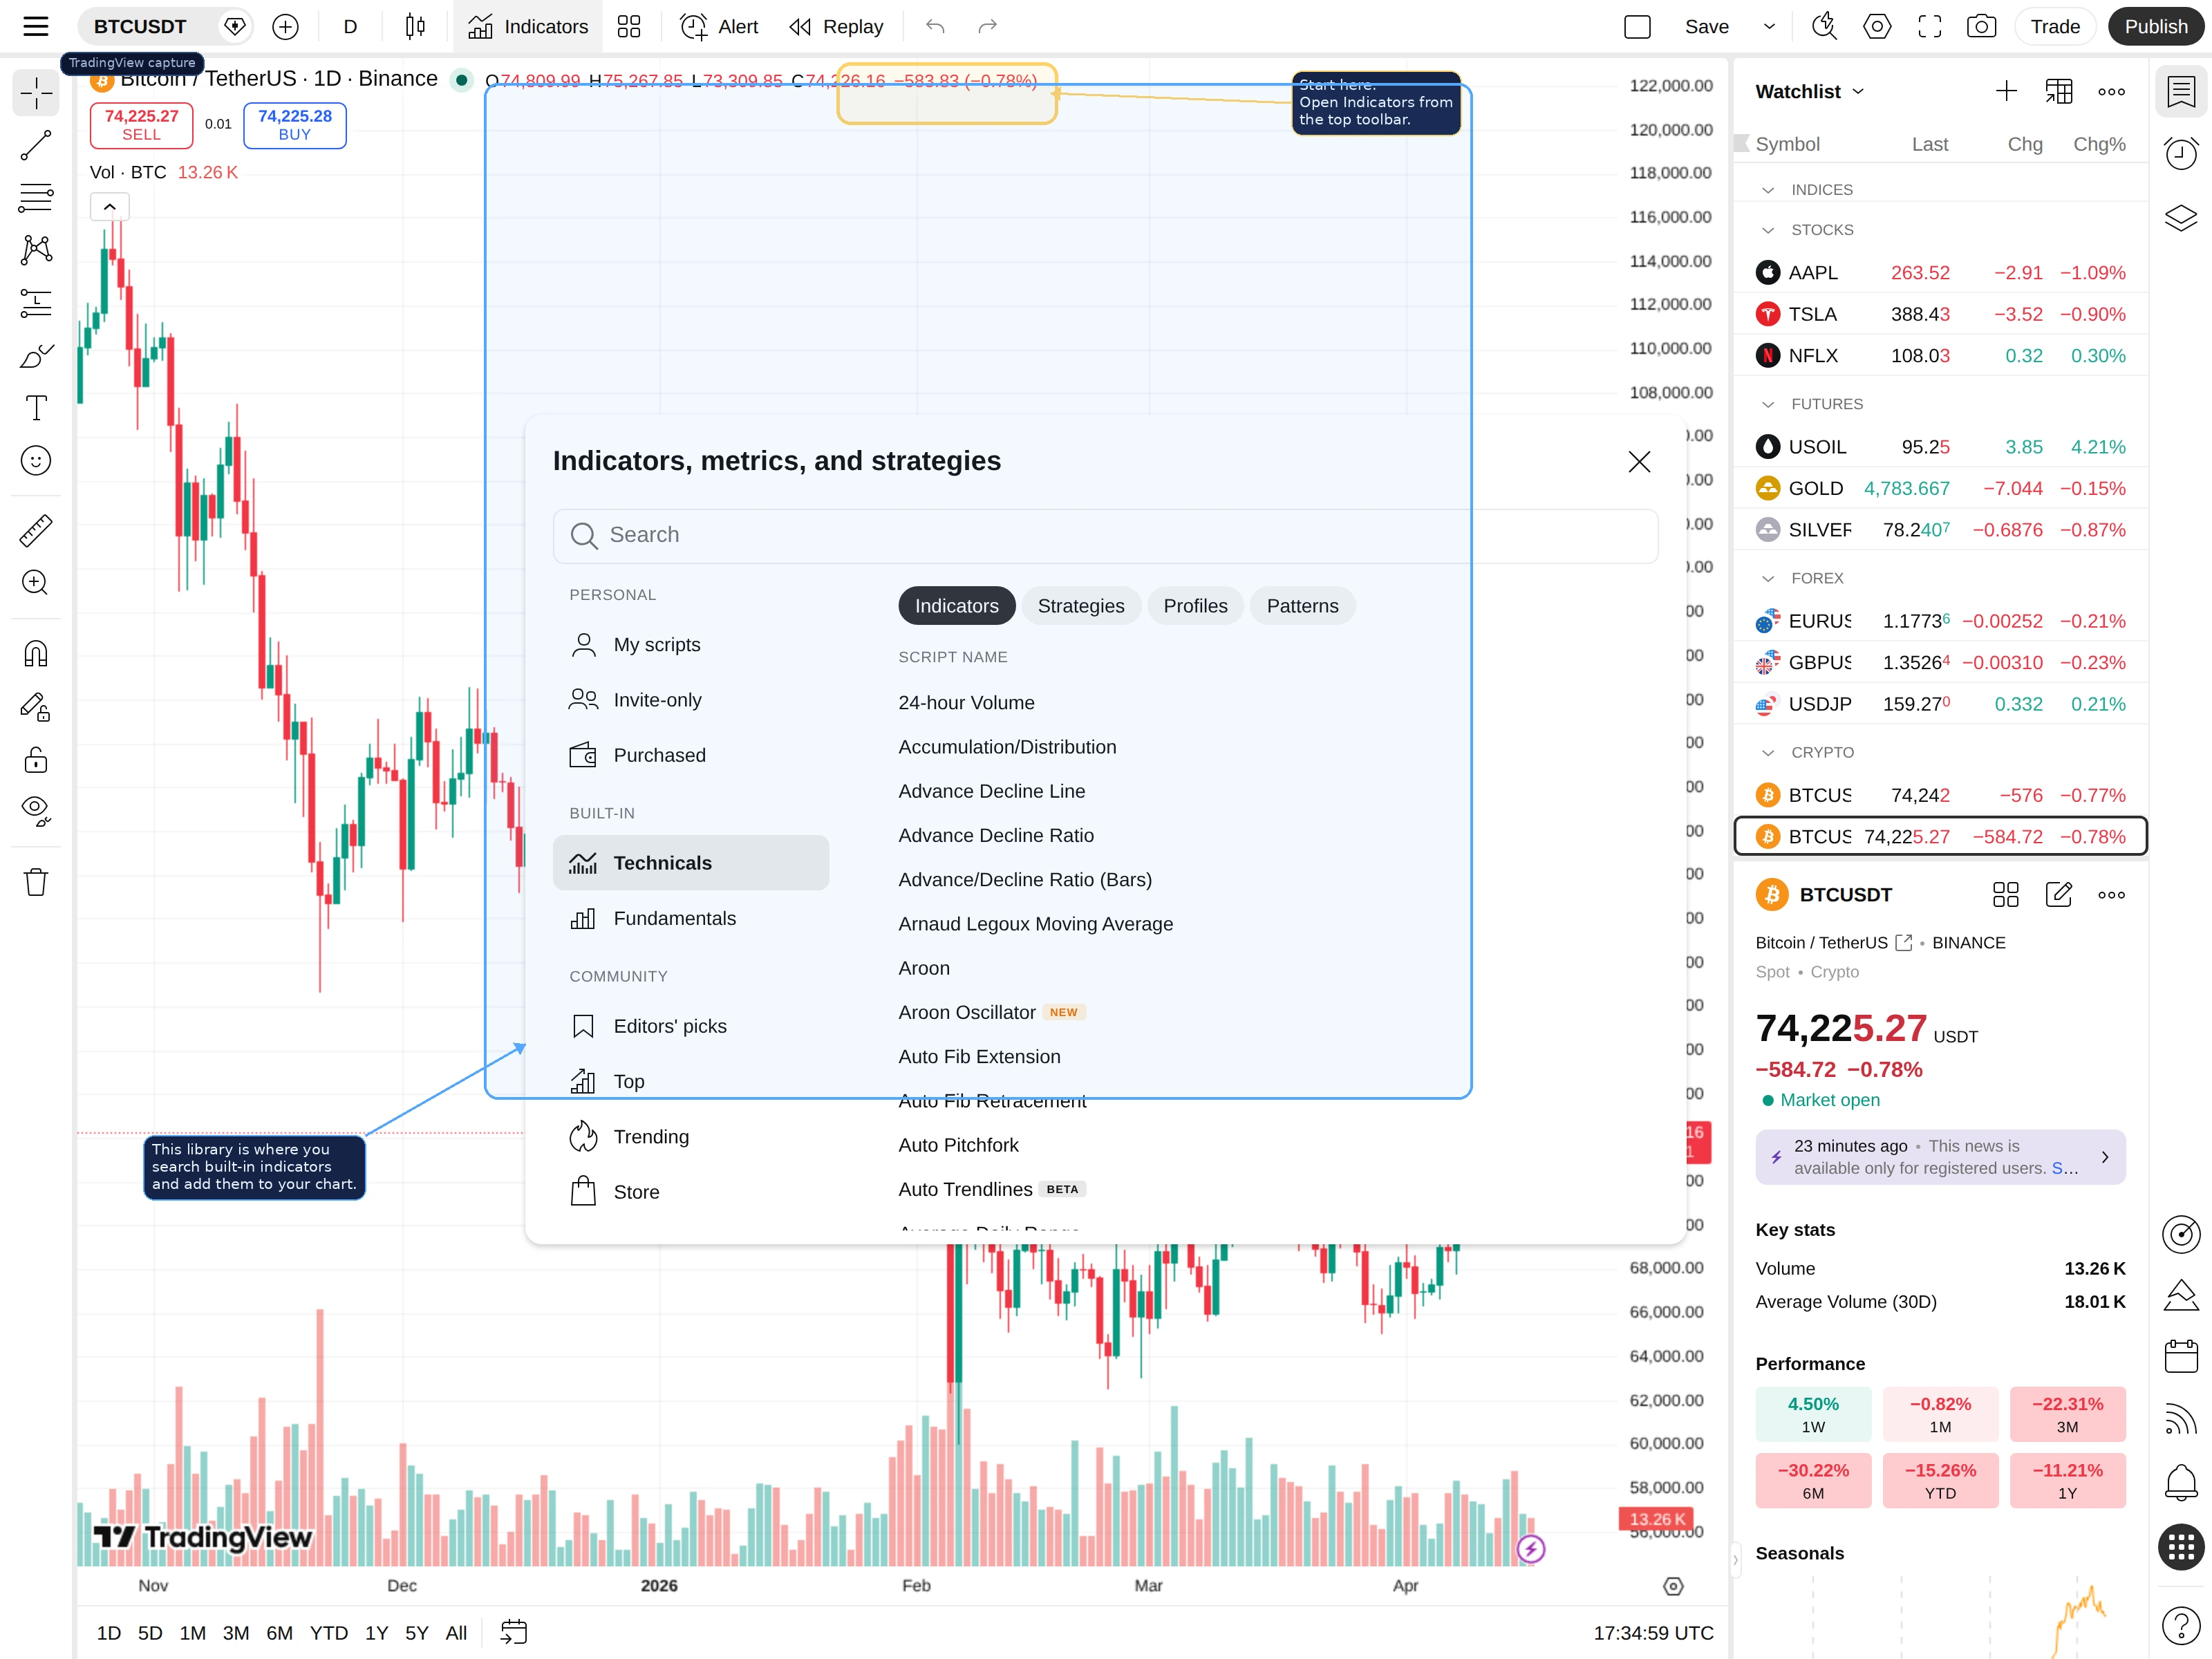
This matters because new traders often add tools mechanically. They click around until the chart looks advanced, but they still do not know what any line is supposed to tell them. The library is a tool chest, not a shortcut to analysis.
Build the Chart in the Right Order
Before you add anything, make sure the chart itself is readable. Price structure comes first. If you cannot see swing highs, swing lows, ranges, or trend direction clearly, indicators will only hide the problem.
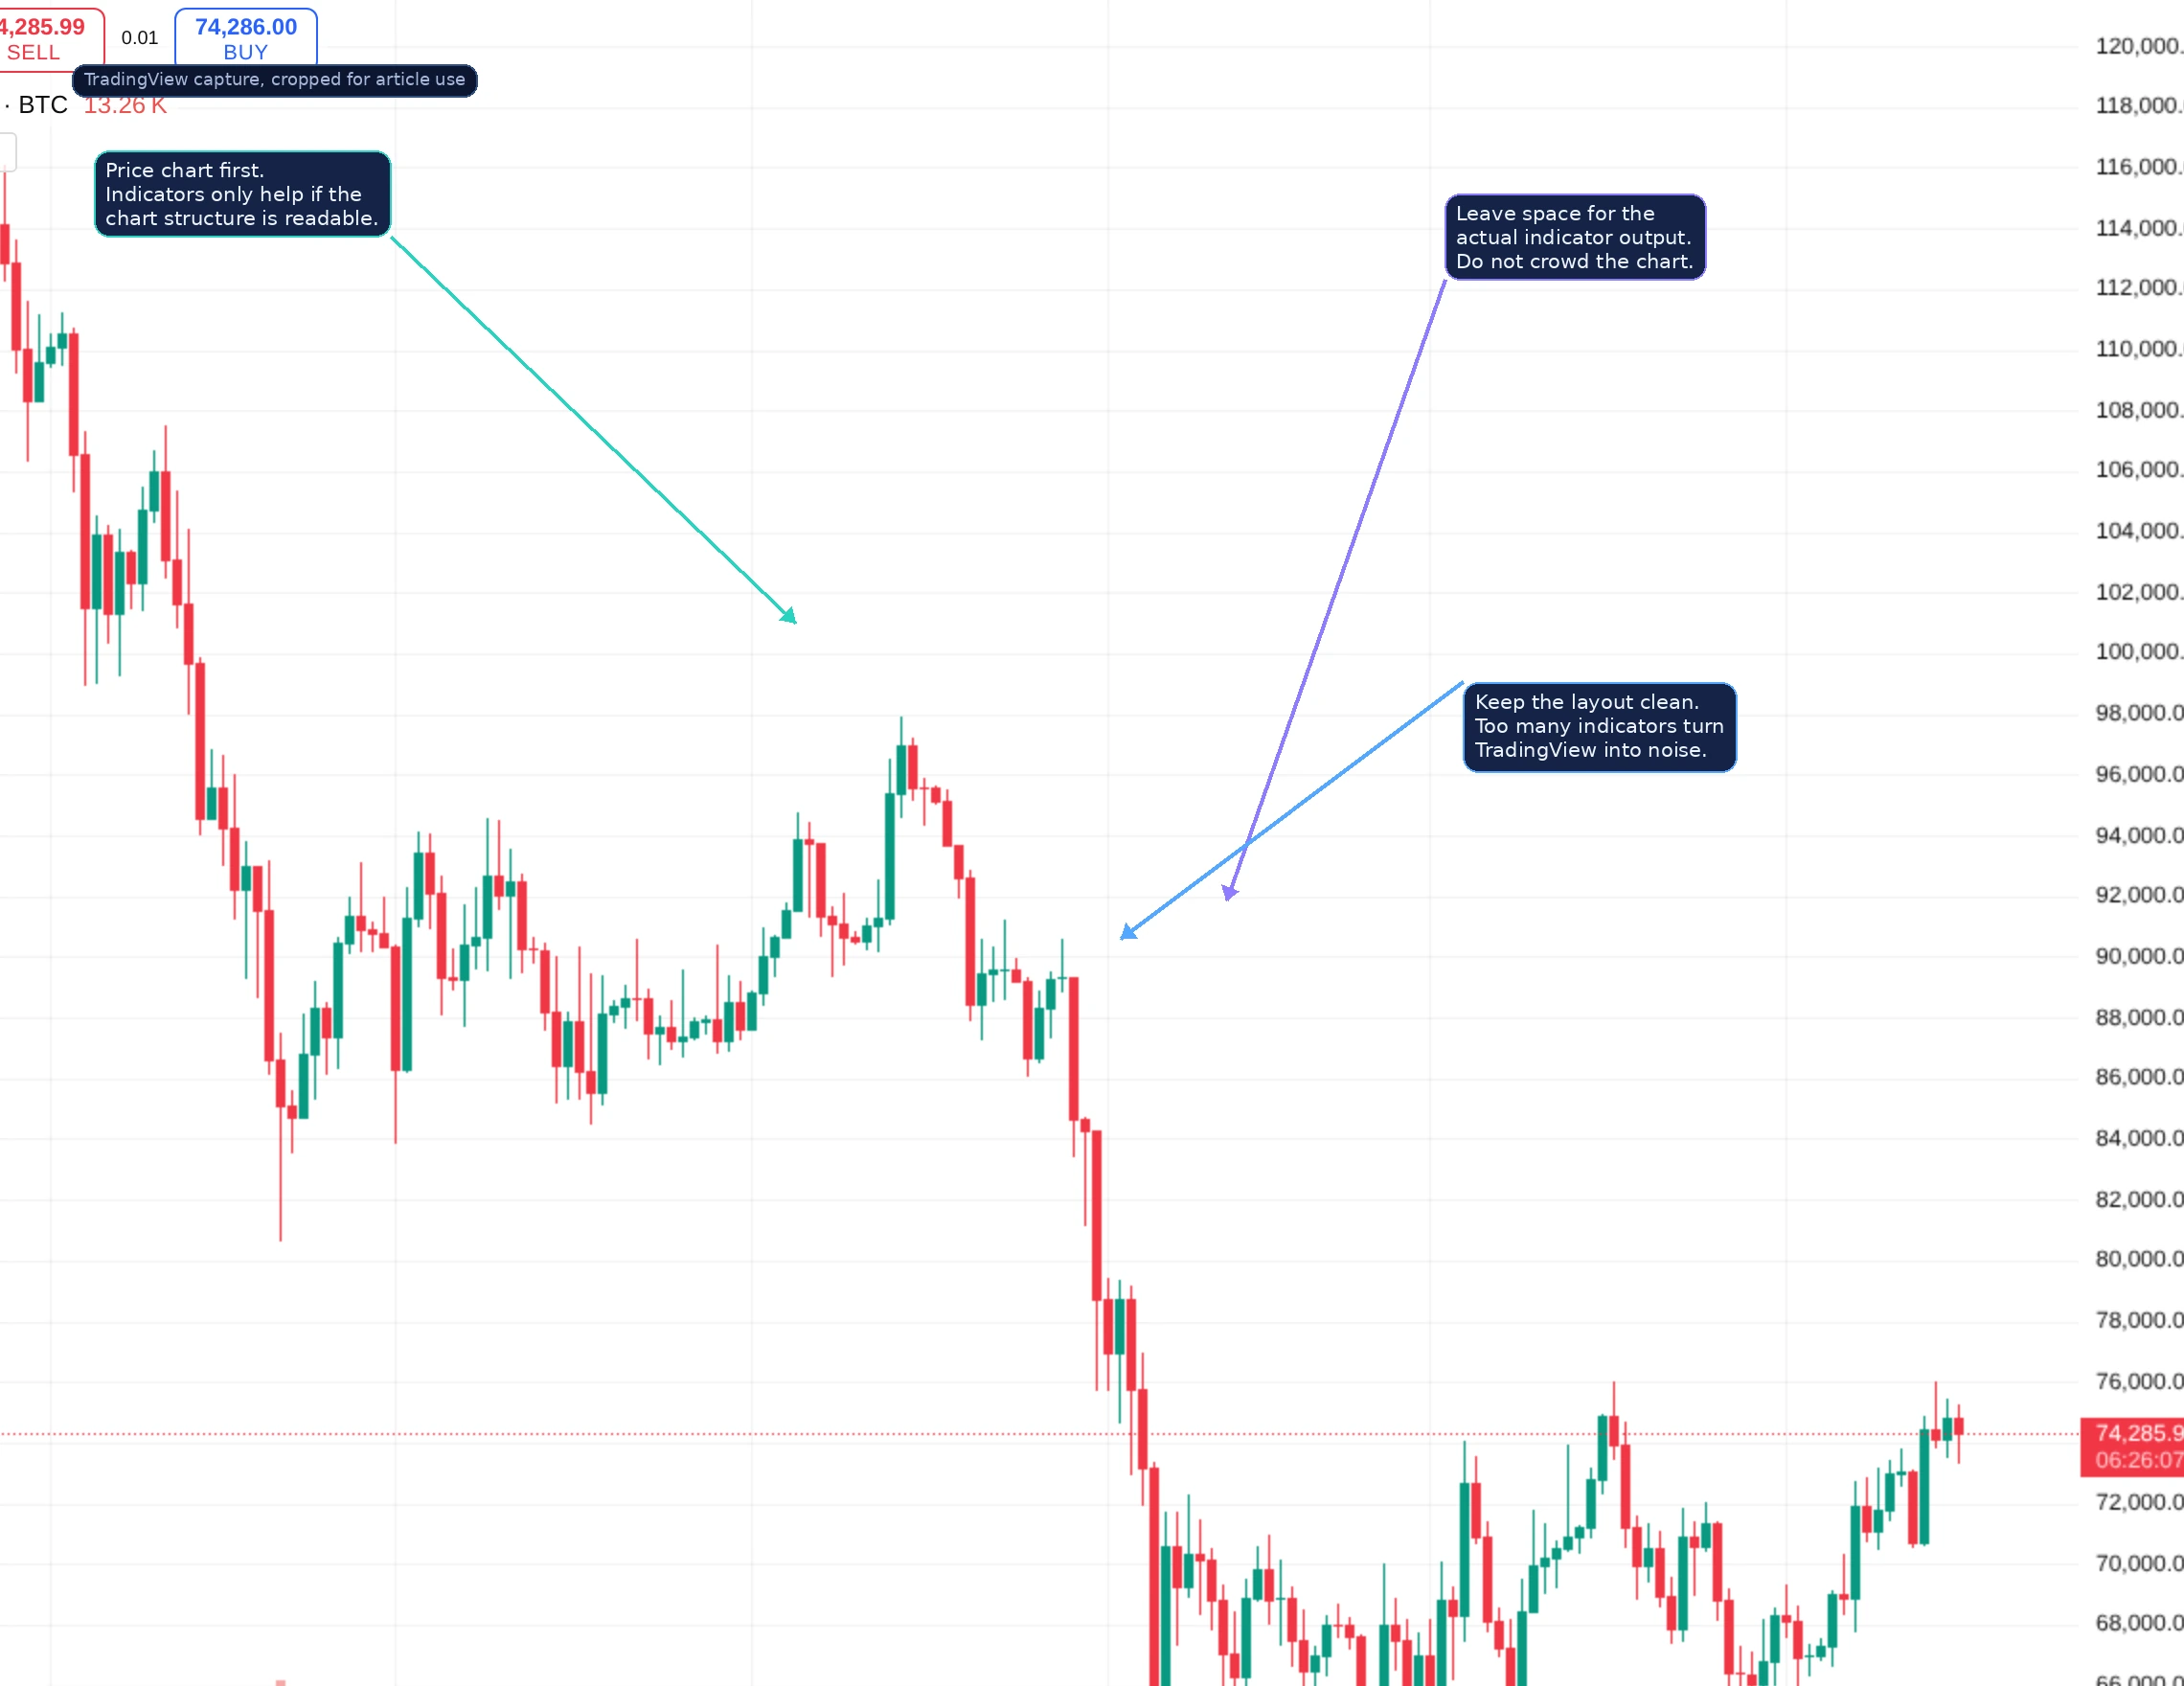
The beginner rule is simple: chart first, indicators second. If the candles, key levels, and obvious price swings are buried under five oscillators and three moving averages, the setup is already broken.
What Kinds of Indicators Actually Matter
Indicators become easier to choose when you group them by job:
- Trend indicators: help frame direction or bias, such as moving averages or anchored VWAP.
- Momentum indicators: help show speed, exhaustion, or acceleration, such as RSI.
- Participation and context tools: help show whether the move is backed by real activity, such as volume or volume profile.
- Volatility tools: help frame expansion and compression, such as Bollinger Bands or ATR-based systems.
This is why a small, intentional stack works better than a huge one. You want each tool to answer a different question instead of repeating the same information three times.
A Simple Beginner Indicator Stack
If you want a clean starting point, use something like this:
- One trend reference, such as a moving average or anchored VWAP.
- One momentum tool, such as RSI.
- One context tool, such as volume or volume profile.
That combination gives you structure without chaos. You get direction, pace, and participation. For most beginner crypto charting, that is enough.
How to Search for the Right Indicator
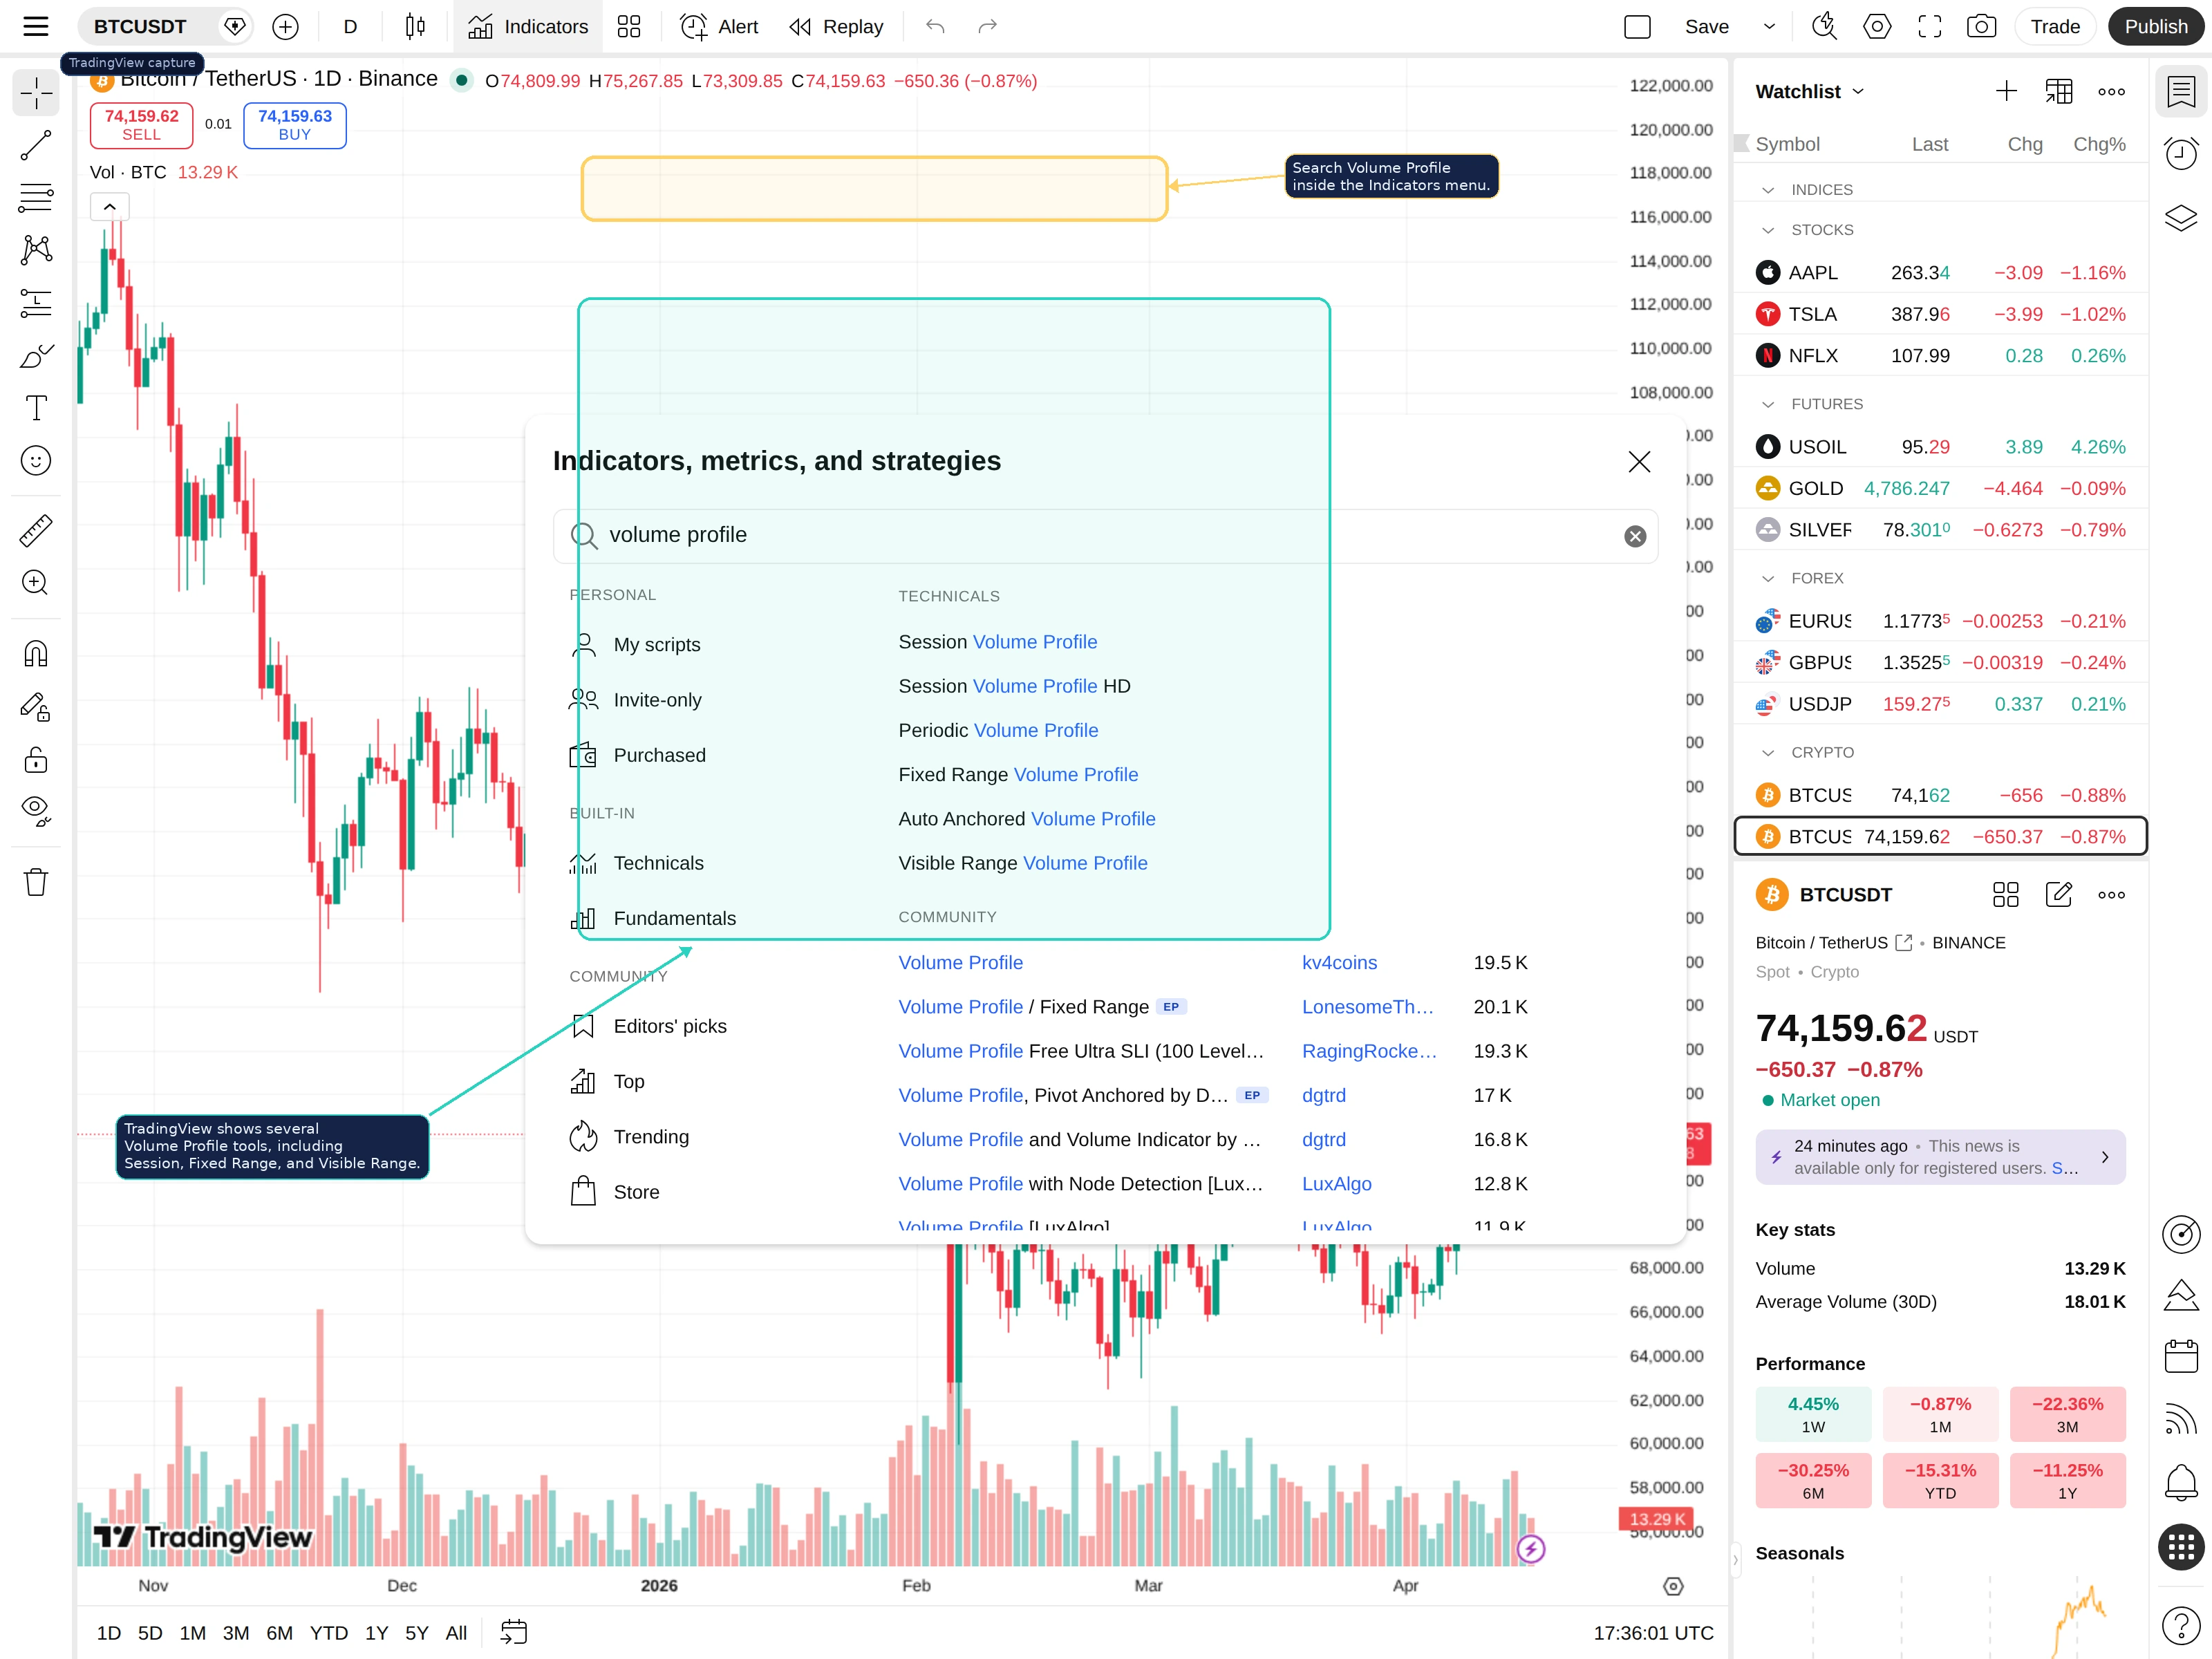
The search bar inside the TradingView library is the fastest way to find what you need. Type the name directly instead of scrolling blindly. This is especially useful when a concept has multiple built-in variations.
For example, a search for volume profile will return several built-in tools, including session, fixed range, periodic, and visible range versions. That is useful because the right tool depends on what question you are trying to answer.
The Biggest Mistake: Indicator Clutter
Indicator clutter usually comes from insecurity. Traders add more tools because they want certainty, but the extra tools rarely provide it. Instead, they create conflicting signals, slower decisions, and a chart that becomes harder to interpret under pressure.
If three indicators are all trying to tell you trend direction, you are not building confirmation. You are often just layering the same lag in different colors. A better chart is one where every added tool earns its place.
What Good Indicator Use Actually Looks Like
A strong TradingView workflow sounds like this: price is holding above a key trend reference, volume is supporting the move, and momentum is cooling without fully breaking. That is a coherent read. A weak workflow sounds like this: one oscillator is overbought, another is neutral, two averages are crossing, and now you are more confused than before.
In other words, indicators work best when they support price action, not when they fight it.
When to Add More Complexity
Only add more tools once you understand what your current stack does well and where it falls short. That is when more advanced tools like volume profile or anchored VWAP become useful. They are not better because they look more advanced. They are better when they answer questions your current setup cannot answer yet.
Frequently Asked Questions
How do you add indicators on TradingView?
Open the chart, click Indicators in the top toolbar, search the tool you want, and add it to the chart.
What are the best TradingView indicators for beginners?
A simple trend reference, one momentum tool, and one participation tool are usually enough for a clean beginner setup.
Should I use many indicators at once?
Usually no. Too many indicators create chart clutter and conflicting signals.
Is TradingView good for crypto?
Yes. It is one of the most popular crypto charting platforms because it combines indicators, drawings, alerts, and multi-timeframe analysis in one workspace.
Related reading
Disclaimer: This article is for educational purposes only and does not constitute investment, financial, legal, or trading advice. Indicators are context tools, not guarantees.
Related Guides
- How to Use Volume Profile in Crypto on TradingView: Setup, Anchors and Execution (2026)
- How to Use TradingView for Crypto: Complete Charting Tutorial 2026
- How to Read Crypto Charts for Beginners: Candlesticks, Indicators and Patterns (2026 Tutorial)
- Meme Coin Chart Indicators and Charting Sites (2026)
- What Is Chainlist: Chain IDs, RPC URLs and EVM Network Setup (2026)