What Is Trading Volume in Crypto? How to Read It (2026)
— By Tony Rabbit in Tutorials
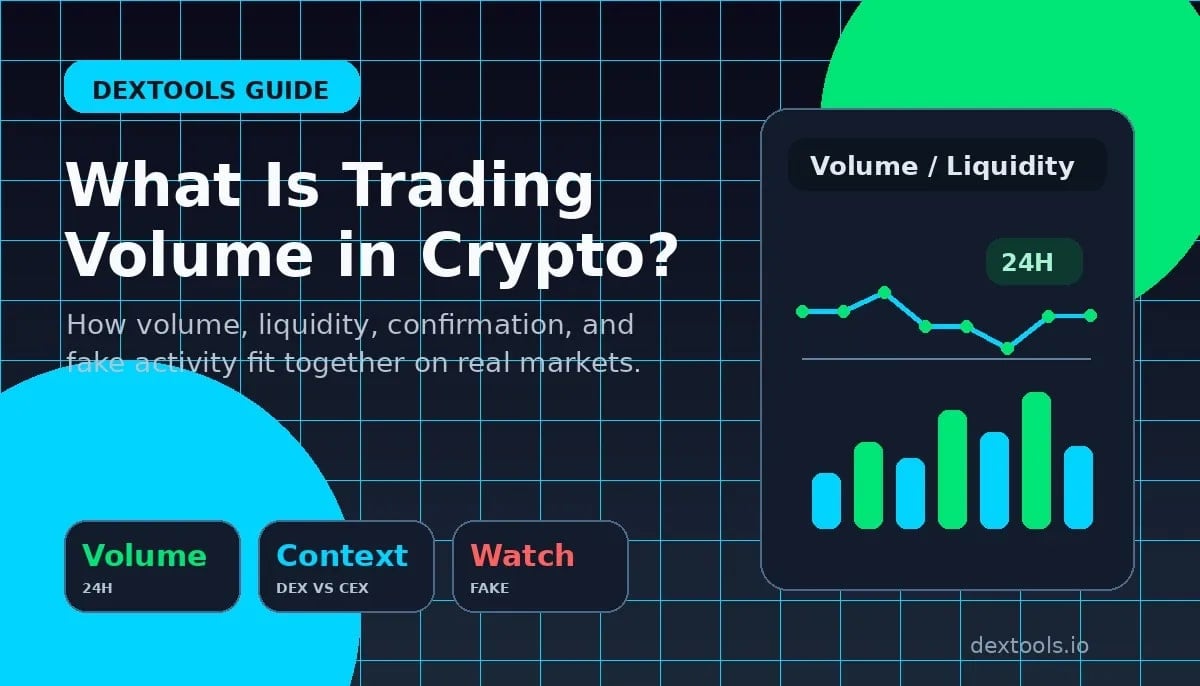
Trading volume in crypto explained: how it differs from liquidity, how to use volume confirmation and divergence, and how to read DEXTools volume panels.
Trading volume in crypto is the amount of an asset that changed hands over a given period. It is one of the fastest ways to judge whether a move has real participation behind it or whether price is drifting on weak conviction. Beginners hear volume mentioned constantly, but many still confuse it with liquidity, market cap, or general hype.
The practical value of volume is simple. It helps you read participation. If price breaks out and volume expands, the move usually carries more weight. If price pushes higher on fading activity, the move may be more fragile. Volume is not a magic predictor by itself, but it is one of the best context tools traders have, especially when you pair it with liquidity and transaction flow.
Quick answer
- Trading volume measures how much actually traded over a period such as 5 minutes, 1 hour, or 24 hours.
- Volume is not the same as liquidity. High volume can still exist in a market with weak depth, and deep liquidity can exist even when the last hour was quiet.
- When price and volume rise together, the move often looks stronger. When price rises while volume fades, conviction may be weaker.
- On DEX markets, use DEXTools volume, liquidity, and transaction panels together instead of reading any one number in isolation.
What Trading Volume Actually Measures
Volume tracks how much of an asset traded during a chosen time window. On some platforms it is shown in token units, on others in dollar terms, and on many analytics dashboards you can view both. The number is not trying to tell you who is right. It is telling you how active the market really was.
A quick way to think about it is: price tells you direction, volume tells you participation. A move with real participation often carries more informational value than the exact same move on very little activity. That is why breakout traders, trend traders, and even longer-term investors keep an eye on volume.
Timeframe matters too. Five-minute volume is useful for reading immediate activity. One-hour volume helps you judge whether momentum is building or fading across a session. Twenty-four-hour volume is better for deciding whether the pair has broad participation at all. A pair can look exciting on one green candle while still being insignificant on the daily view.
This is one reason DEXTools is so practical for volume work. You can move between chart timeframes, compare the recent bars with the broader context, and avoid overreacting to one noisy burst of activity.
Volume vs Liquidity
Volume and liquidity are related, but they are not interchangeable. Volume is what traded. Liquidity is how much tradable depth exists around the current price. A pair can print decent volume during a volatile burst and still have weak liquidity for the next order. That is why traders get trapped when they look at volume alone.
Volume and liquidity are different tools
Volume Confirmation vs Divergence
Volume becomes more useful when you stop treating it like a standalone predictor and start using it as a confirmation tool. If price breaks a range and volume expands, the move often deserves more respect because more market participants were involved. If price creeps upward while volume fades, the move may still continue, but it often looks less convincing.
How traders usually read it
That is also why volume should be read alongside market structure. A weak-looking breakout into heavy resistance may still fail even if volume rose. Volume helps you judge conviction, not remove the need for context.
Fake Volume and Wash Trading Warning Signs
Not all volume is equally trustworthy. Some venues or token teams can create activity that looks impressive without reflecting real organic participation. On centralized exchanges this can appear as suspiciously inflated reported volume. On DEX pairs, it can show up through self-trading, recycled flow, or activity that looks large on paper but sits on top of shallow liquidity.
Warning signs that volume may be misleading
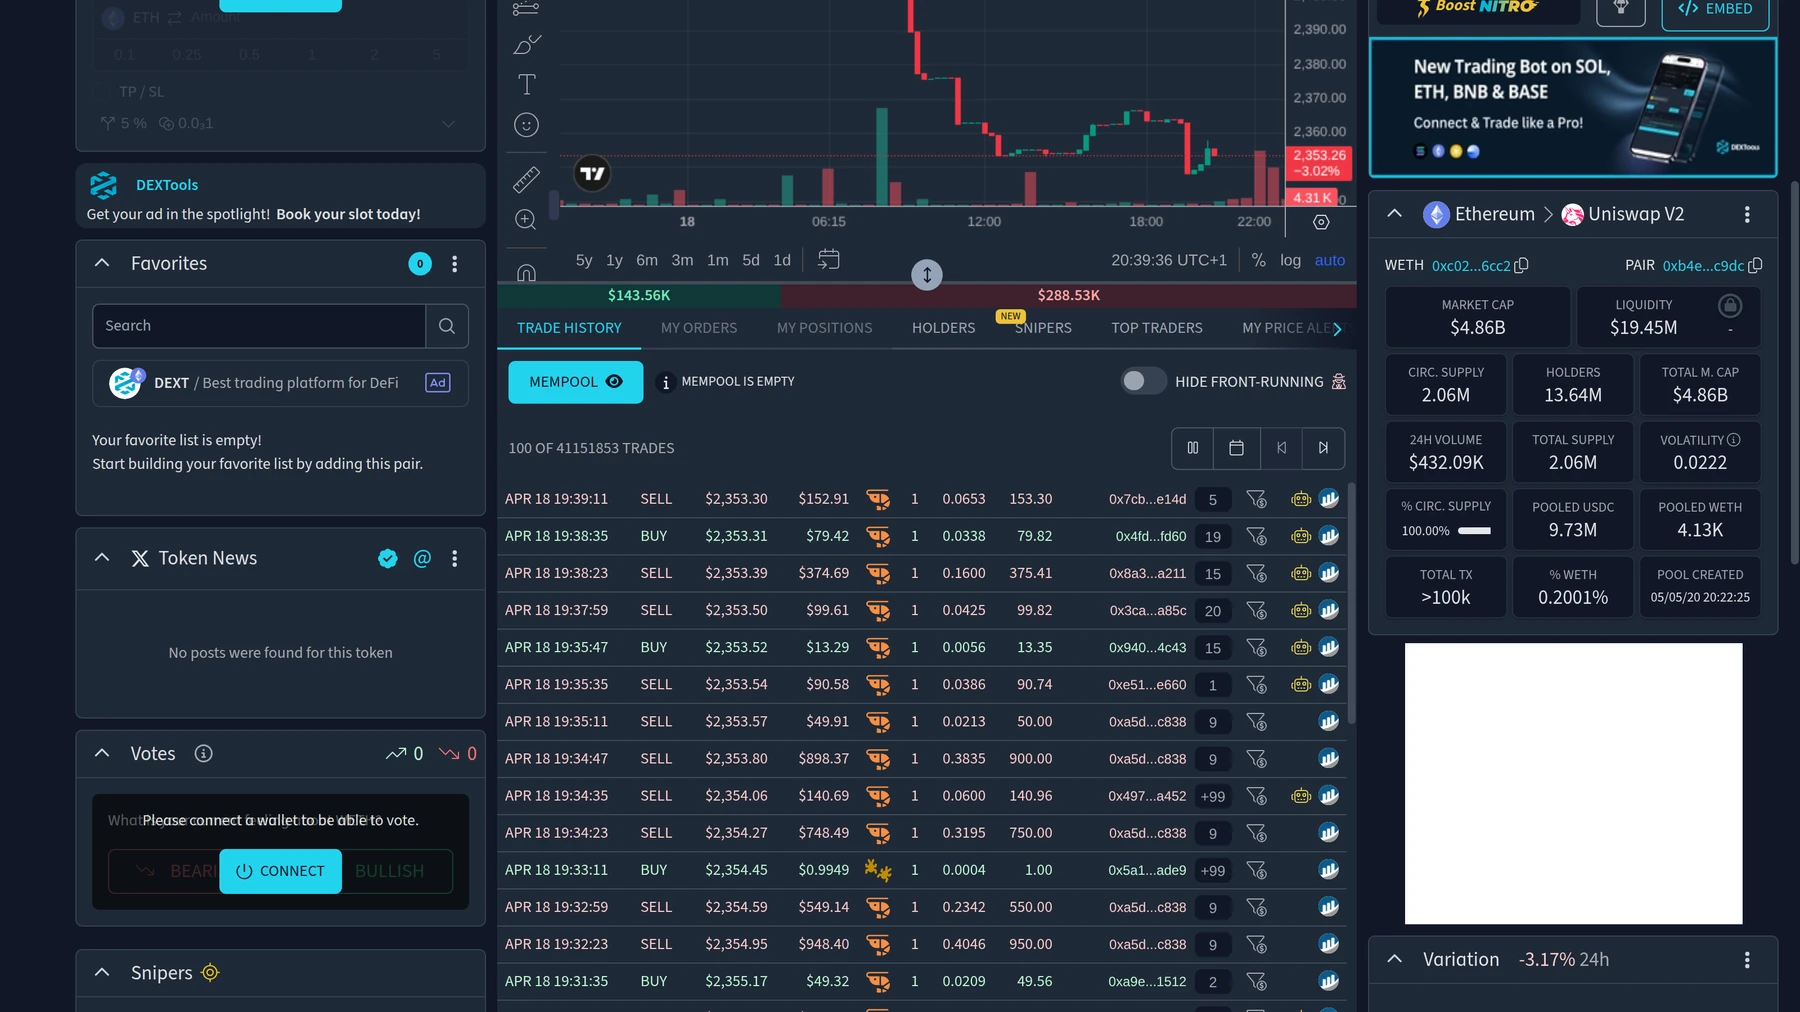
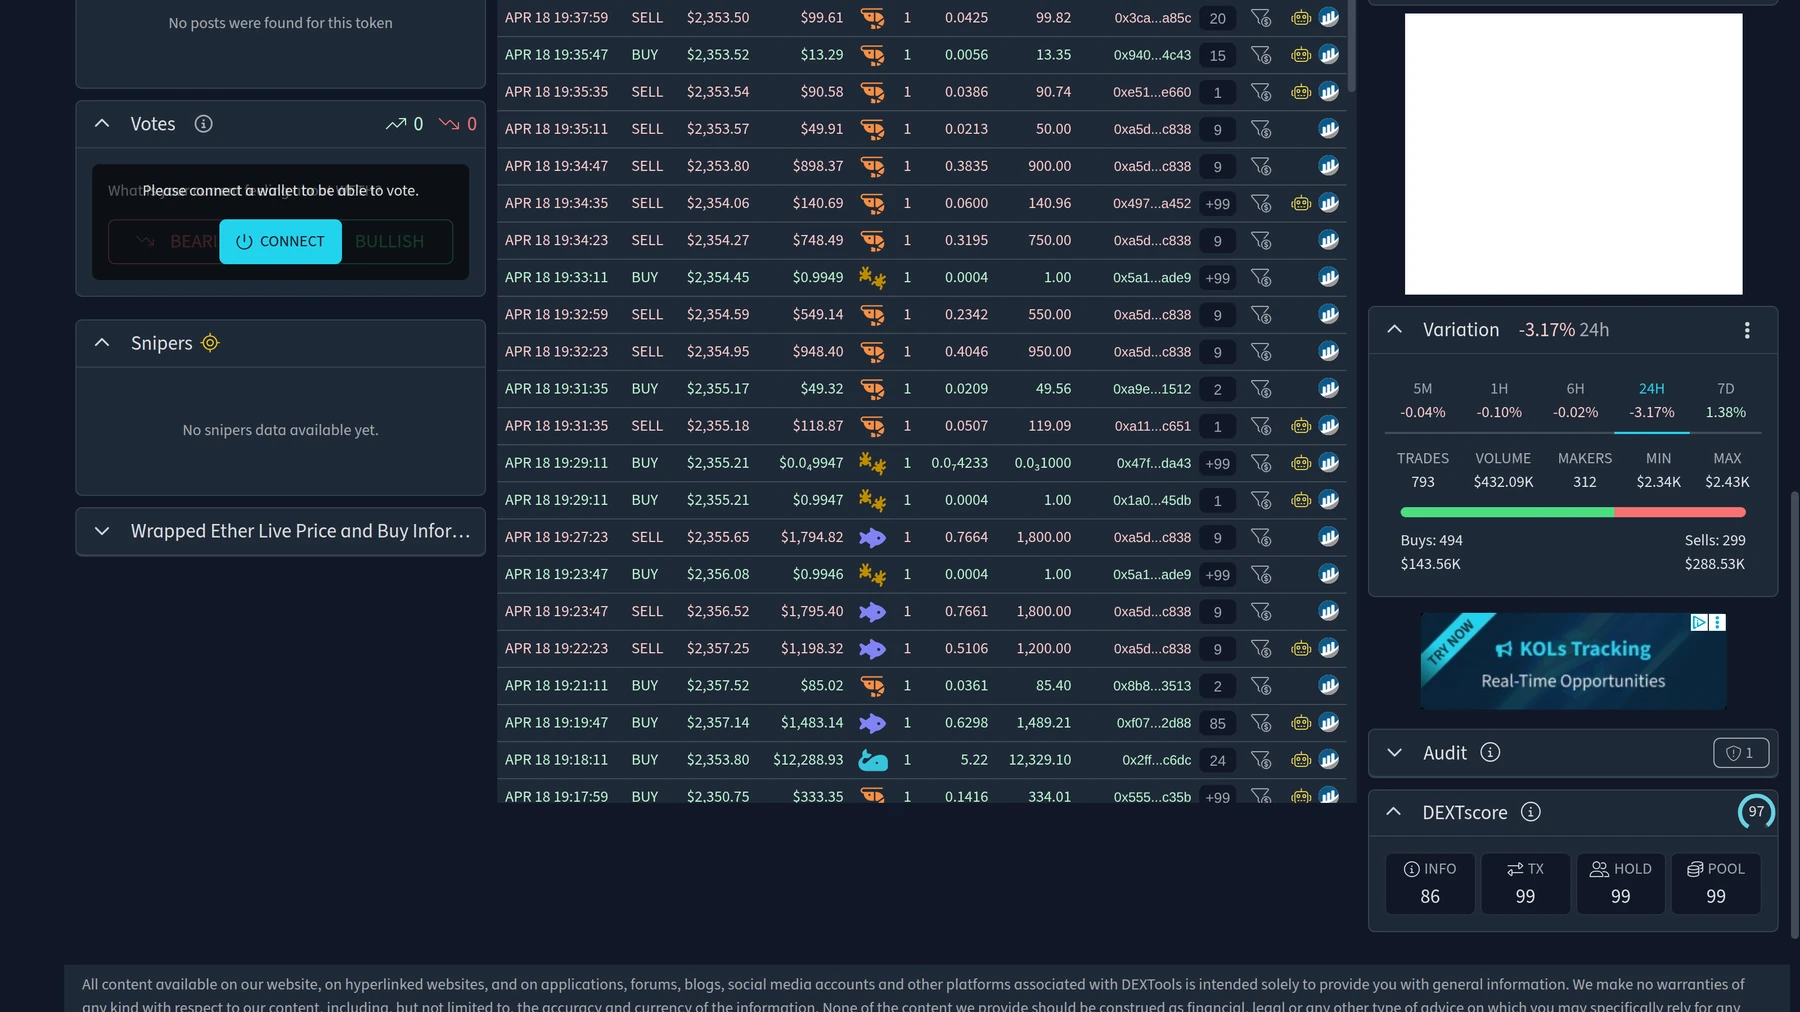
This is where DEXTools is especially useful. You are not limited to one reported number. You can compare volume with liquidity, look at the transaction tape, inspect the chart, and see whether buys and sells look natural. Fake-looking activity often fails one of those cross-checks.
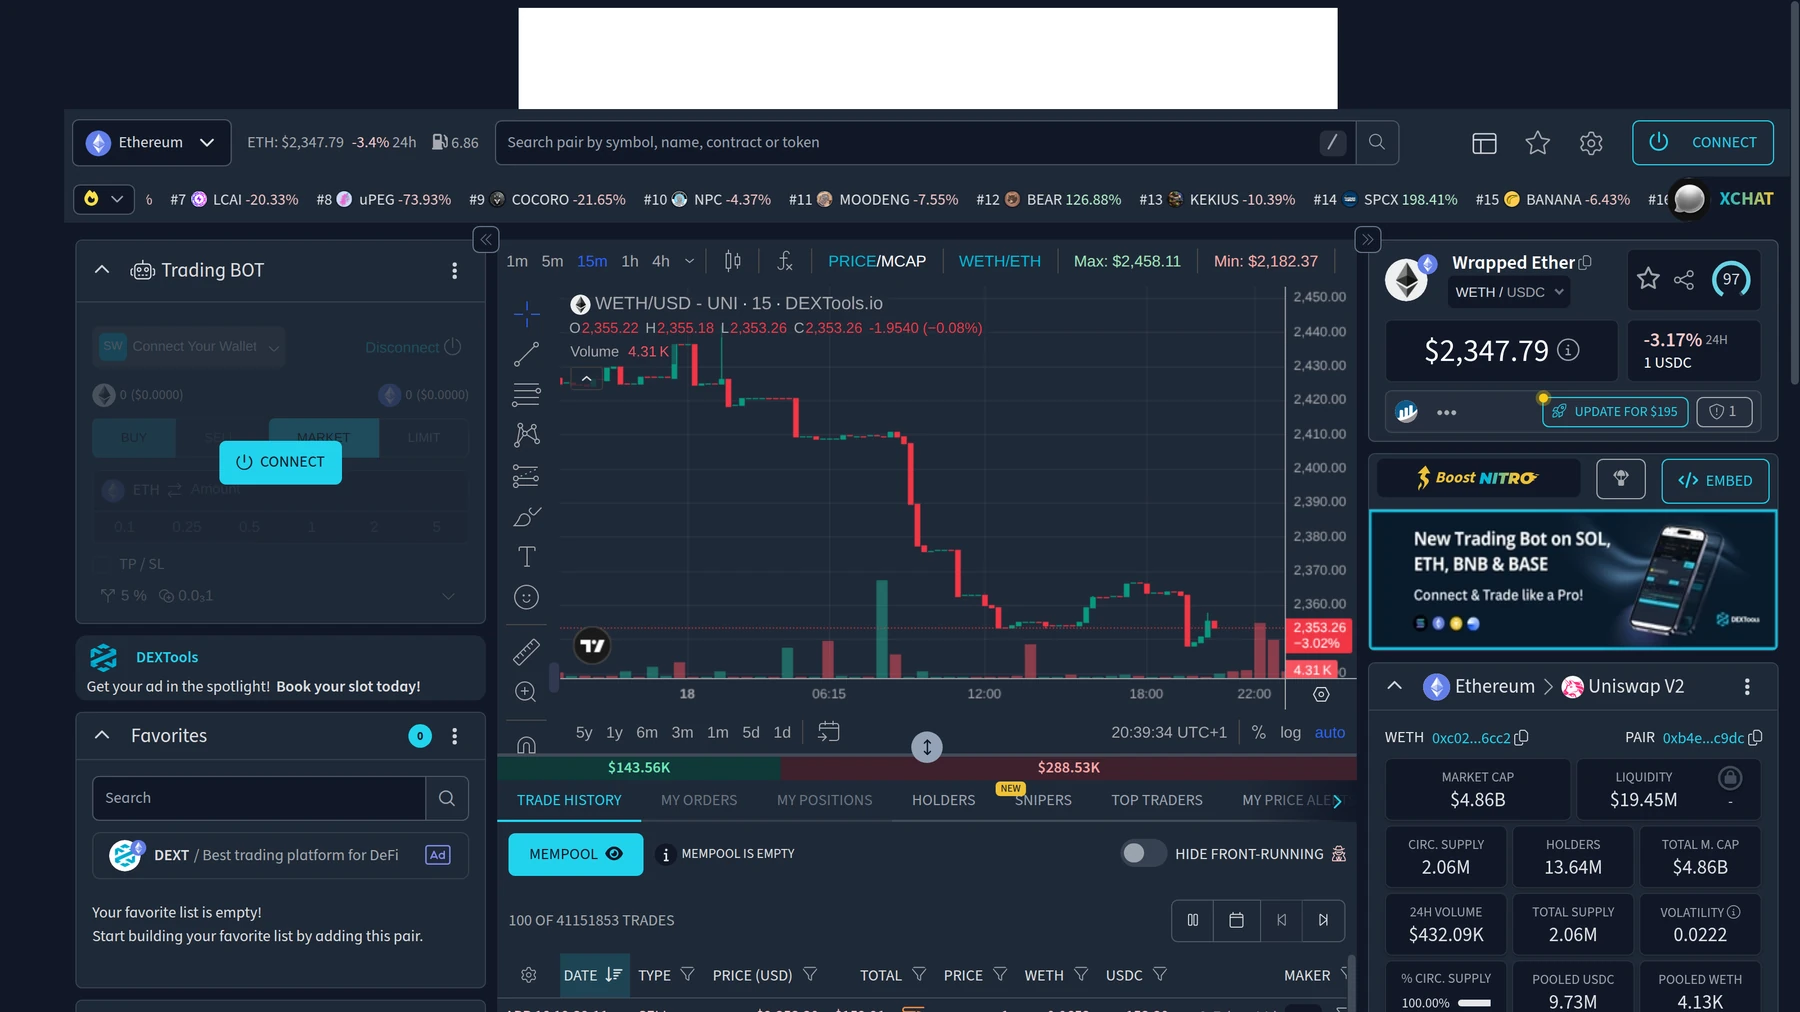
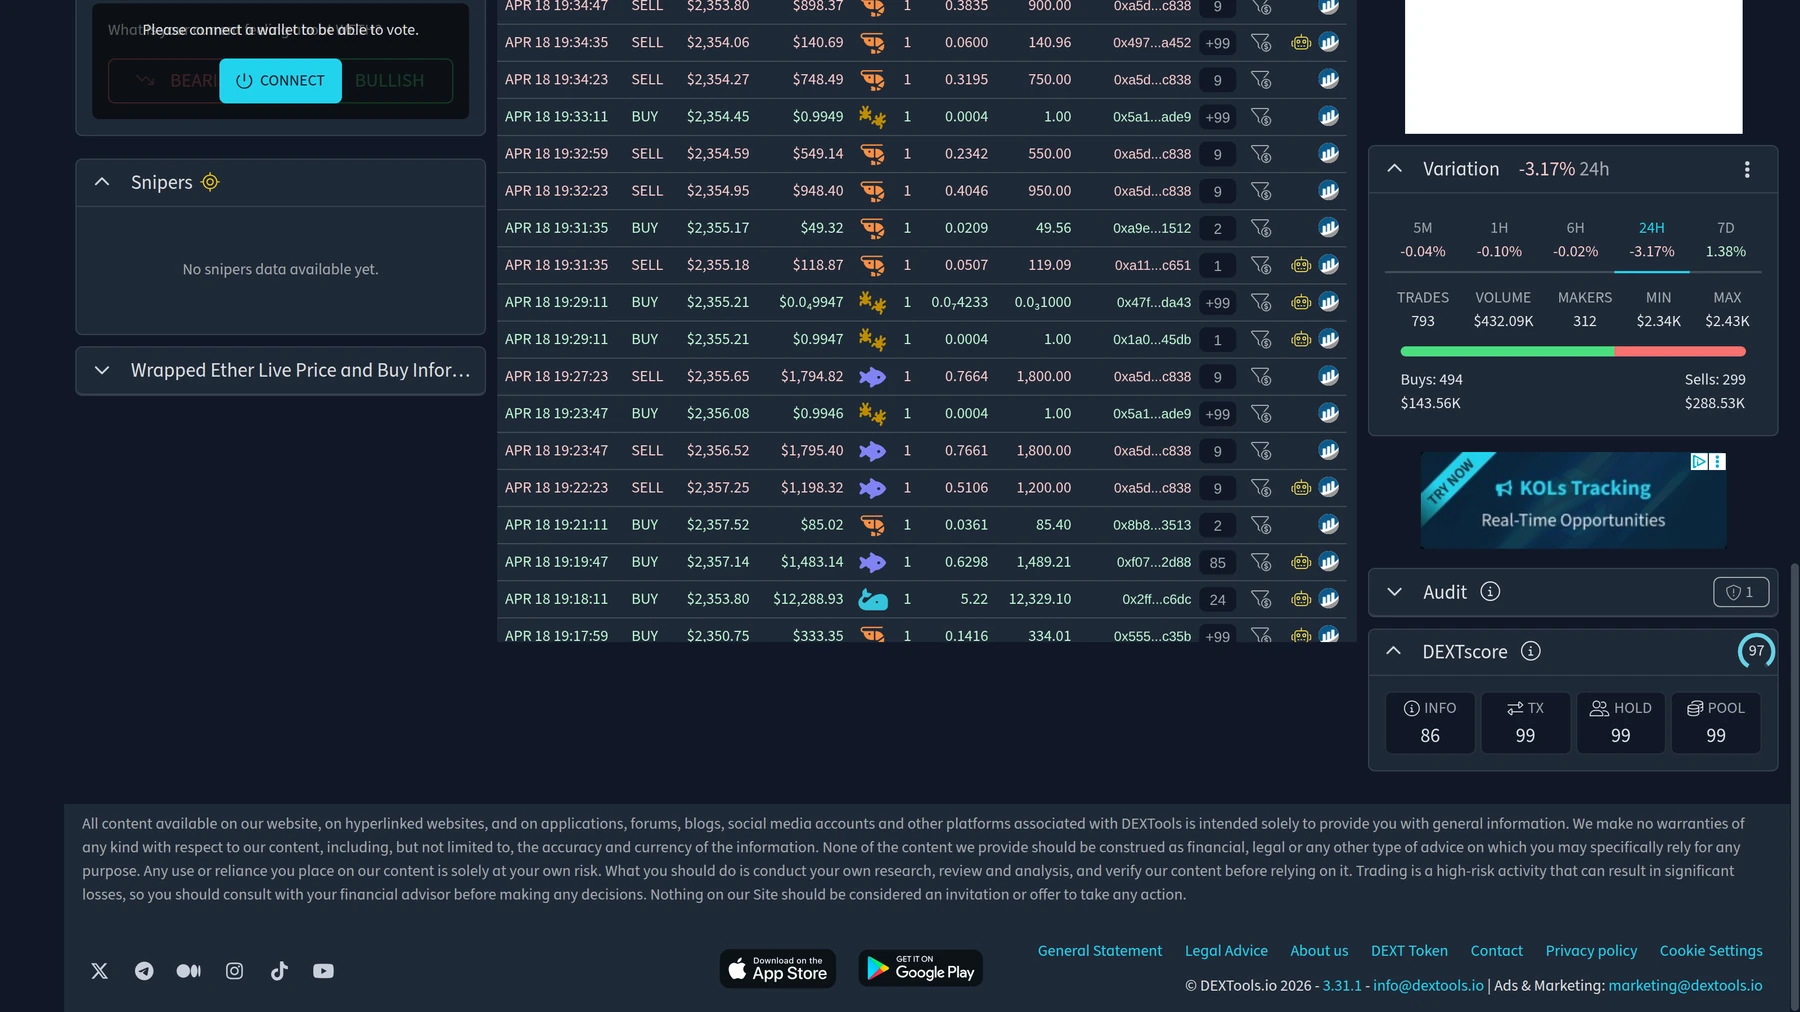
How to Use DEXTools Volume Panels in Practice
DEXTools is strongest when you use its panels together. Start with the pair overview to check whether the market is worth your attention at all. Then move to the chart and volume bars to see whether recent moves had participation. Finally, inspect the pair information and transactions panels to understand whether the activity looks broad, one-sided, or suspiciously noisy.
A practical DEXTools volume workflow
- Check the timeframe. Five-minute volume and 24-hour volume answer different questions.
- Compare volume with liquidity before assuming the pair is clean enough to trade.
- Look at the chart and ask whether price expansion came with expanding participation.
- Open recent transactions and see whether the flow looks natural or suspiciously circular.
- Use volume as context, not as permission to ignore spread, slippage, or structure.
DEX Volume vs CEX Volume
DEX and CEX volume are related but not identical. Centralized exchanges usually aggregate a large order book and may report very high headline volume on majors. DEX volume is pair-specific and tied to actual on-chain pools and swaps. That often makes DEX analysis more grounded in what happened on a specific route, but it also means you need to care more about liquidity and pool depth because execution quality can change faster.
In other words, CEX volume is often broader and more aggregated. DEX volume is often more local and more directly linked to the exact pair you are trading. That is one reason DEXTools works well for pair-level decision making. It shows the context that matters when the trade is actually going through that pool.
Frequently Asked Questions
What is trading volume in crypto?
It is the amount of an asset that traded over a chosen period, often shown in token units, dollar terms, or both.
Is high volume always bullish?
No. High volume only tells you participation was high. It can confirm bullish strength, bearish pressure, or chaotic two-way activity depending on the context.
What is the difference between volume and liquidity?
Volume measures what traded. Liquidity measures how much tradable depth exists near the current market and how cleanly you can enter or exit.
How can I spot fake volume in crypto?
Compare the reported activity with liquidity, spread, transaction flow, and price behavior. If the headline number looks huge but execution quality still looks poor, be skeptical.
How does DEXTools help with volume analysis?
DEXTools lets you read volume together with liquidity, price action, and the recent transaction tape, which makes it easier to judge whether a move looks real.
Related DEXTools tutorials
- What Is an Order Book in Crypto?
- What Is Bid-Ask Spread in Crypto?
- Spot vs Futures in Crypto: Complete Beginner Guide (2026)
- Crypto Order Types: The Complete 2026 Guide
- What Is On
Disclaimer: This article is for educational purposes only and does not constitute investment or trading advice. Volume metrics can vary by venue and should always be interpreted with liquidity, structure, and execution quality in mind.
Related Guides
- Wash Trading Red Flags on Exchanges and DEXs (2026)
- DEX Net Inflows vs. Trading Volume: Capital Rotation?
- Open Interest vs Volume in Crypto Trading (2026)
- Fake Volume vs Real Demand: How to Spot Artificial Momentum in DeFi Trading
- What Is Order Flow in Crypto Trading? How to Read Buying and Selling Pressure (2026)