What Is the Keltner Channel in Crypto Trading? 2026 Guide
— By Tony Rabbit in Tutorials
Learn how the Keltner Channel uses an EMA and the Average True Range to map volatility, trend direction, and breakouts in crypto trading.
Volatility is the heartbeat of crypto markets, and reading it well is one of the clearest edges a trader can develop. The Keltner Channel is a volatility based indicator built for exactly that purpose. It wraps a moving average inside two dynamic bands so you can see, at a glance, when price is stretching, calming down, or preparing to move. Because it adapts to changing conditions, it suits the fast swings of digital assets far better than any fixed line drawn on a chart.
In this 2026 guide we break down what the Keltner Channel is, how its three lines are calculated, and how crypto traders use it to gauge trend direction, spot breakouts, and read overbought or oversold conditions. We also cover the popular squeeze technique that pairs it with Bollinger Bands. None of this is financial advice, so treat every signal as one input among many and always confirm before acting.
What Is the Keltner Channel?
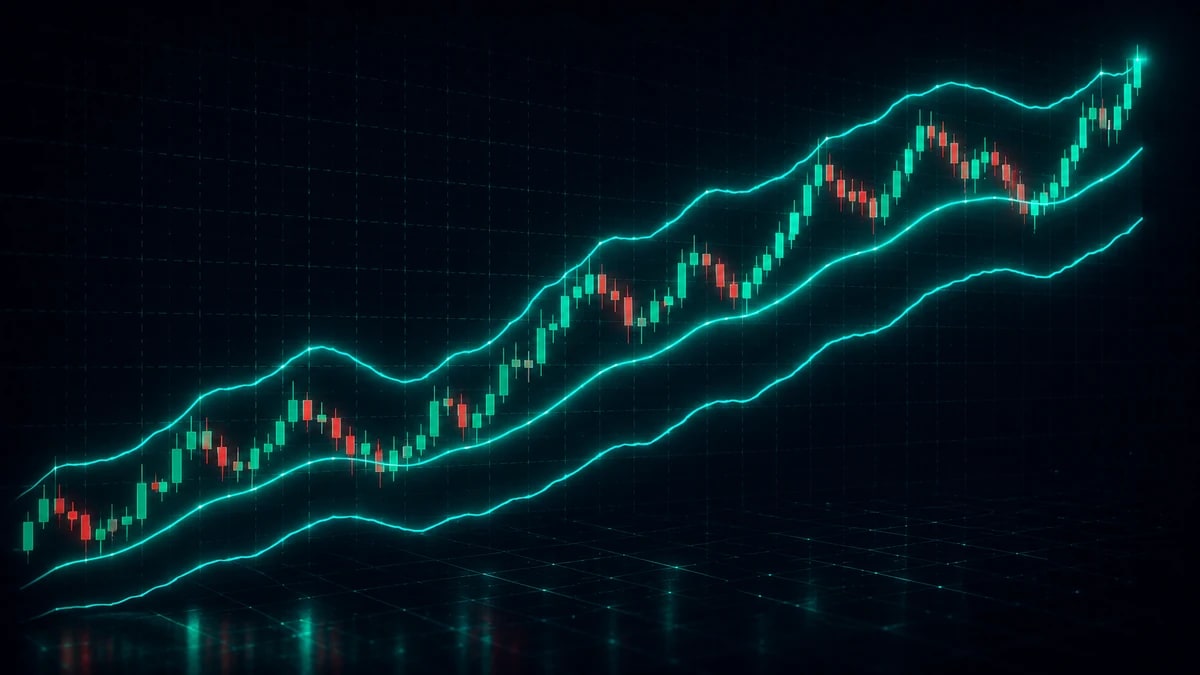
The Keltner Channel is a volatility based indicator made up of three lines plotted directly on the price chart. At its core sits a central exponential moving average, commonly set to 20 periods. Around that center line the indicator draws an upper band and a lower band, each placed a multiple of the Average True Range away from the middle. A common setting is two times ATR, which means the bands sit twice the recent average range above and below the EMA.
Because the bands are driven by the Average True Range, they expand when volatility rises and contract when the market quiets down. This gives the channel a breathing quality. When crypto markets are choppy and ranges widen, the channel widens with them. When activity dries up, the bands pull in tight. That responsiveness is what makes the tool so useful across the wildly different volatility regimes you see in digital assets.
How the Keltner Channel Is Calculated
The math behind the channel is straightforward, and understanding it helps you trust the signals it produces. There are three components, each building on the one before it.
The Center Line
The middle line is an exponential moving average of price, most often over 20 periods. An EMA reacts faster to recent prices than a simple moving average, so the center line stays close to current action rather than lagging far behind. This line acts as the baseline that the bands reference.
The Upper and Lower Bands
To build the bands, you take the Average True Range over a chosen lookback, multiply it by a factor such as two, and then add that value to the EMA for the upper band and subtract it for the lower band. The result is a corridor that hugs price during calm phases and flares out during volatile ones. Adjusting the ATR multiplier changes how often price reaches the bands, so a larger multiple produces wider, less frequent touches.
Keltner Channel vs Bollinger Bands
Traders often ask how the Keltner Channel differs from Bollinger Bands, since both wrap a moving average in two outer lines. The key distinction lies in what drives the bands. Bollinger Bands measure distance using standard deviation, while the Keltner Channel uses the Average True Range. Because ATR smooths price movement differently than standard deviation, Keltner Channels tend to look smoother and produce fewer jagged reactions to single sharp candles.
This smoothness can be an advantage when you want a cleaner read on trend, but it also means the two tools shine in different ways. Many traders run both at once rather than choosing between them, because the relationship between the two sets of bands reveals information neither indicator shows on its own.
How Crypto Traders Use the Keltner Channel
The indicator earns its place in a trading toolkit through a handful of practical reads. Each one answers a different question about the current state of the market.
Identifying Trend Direction
One of the cleanest uses is judging trend strength. In a healthy uptrend, price tends to ride the upper band, repeatedly pushing toward it and pulling back only to the rising center line. In a downtrend, price hugs the lower band in the same way. When candles consistently close in the upper half of the channel, buyers are in control, and the opposite holds for the lower half.
Spotting Breakouts
A close outside a band can signal a breakout. When price closes above the upper band after a quiet stretch, it often means momentum has shifted decisively, and the same logic applies to closes below the lower band. The word close matters here. A wick that briefly pierces a band but pulls back inside is far weaker than a full candle close beyond it.
Gauging Overbought and Oversold Stretches
In ranging conditions, the bands can flag overextended moves. Price stretching to the upper band may be running ahead of itself, while a tag of the lower band can mark an oversold dip. This read works best when the market is not strongly trending, because during powerful trends price can ride a band for a long time without reversing.
The Keltner Channel Squeeze
One of the most popular techniques combines the Keltner Channel with Bollinger Bands to find a squeeze. A squeeze forms when the Bollinger Bands contract so much that they move inside the Keltner Channel. Because Bollinger Bands react more sharply to falling volatility, them slipping within the steadier Keltner bands signals an unusually quiet market.
That calm rarely lasts. A squeeze is widely read as a coiled spring, a period of low volatility that often precedes a larger move. Traders watch for the Bollinger Bands to expand back outside the Keltner Channel, then take the direction of the first decisive close as a cue for which way the breakout may run. The squeeze itself does not predict direction, only that energy is building.
Settings and Best Practices
The default configuration of a 20 period EMA with bands set two times the Average True Range is a sensible starting point for most crypto pairs. From there, shorter EMAs and smaller multipliers make the channel more sensitive and better suited to lower timeframes, while longer settings smooth things out for swing trading. There is no perfect number, so backtest changes on the assets and timeframes you actually trade.
Above all, the Keltner Channel works best with confirmation. A band touch or a squeeze breakout becomes far more reliable when supported by volume, momentum readings, or a clear level of support and resistance. You can layer the indicator over live charts inside platforms such as DEXTools to combine it with on chain data and pair level context. Treat the channel as a lens for volatility, not a standalone trading system.
Conclusion
The Keltner Channel is a clean, adaptable way to visualize volatility, trend, and breakout potential in crypto. By centering an exponential moving average and wrapping it in bands driven by the Average True Range, it adjusts naturally to the constant shifts that define digital asset markets. Its smoother behavior compared with Bollinger Bands makes it a favorite for reading trend, while the squeeze setup turns the two tools into a powerful early warning system for low volatility periods. Start with the standard settings, always wait for confirmation, and remember that no indicator removes risk. None of this is financial advice, so use the Keltner Channel as one informed input within a broader, well tested plan.
Keltner Channels and the Nuance of Crypto Market Structure
While the Keltner Channel provides excellent visual cues for trend and volatility, its true power in crypto trading lies in understanding how it interacts with underlying market structure. Unlike traditional assets, crypto often exhibits flash crashes, rapid "V" shaped recoveries, and prolonged periods of low liquidity followed by explosive moves. The Keltner Channel, particularly its ATR component, dynamically adapts to these unique characteristics, offering a more robust volatility measure than static percentage bands.
For DEXTools traders, this means paying close attention not just to channel breakouts, but also to the *context* of those breakouts. Is the price breaking out from a tight consolidation on low volume, or is it pushing through after a significant liquidity event? The channel's width itself becomes a critical indicator of market sentiment and potential future movement. A persistently narrow channel, for example, often precedes a major expansion, signaling accumulation or distribution phases.
Practical Applications for DEXTools Traders
- Identify "squeeze" plays: Look for periods where the Keltner Channel's upper and lower bands converge tightly, indicating contracting volatility and often preceding a significant price expansion or contraction.
- Confirm trend strength during pullbacks: Price retracing to the EMA midline within the channel during an uptrend, and then bouncing, can confirm the trend's health and offer potential entry points.
- Spot "fakeouts": A brief poke outside the channel that quickly reverses back inside, especially on lower volume, can signal a liquidity grab rather than a true breakout.
- Gauge overbought/oversold conditions in trending markets: While not an oscillator, persistent closes near the upper or lower bands can suggest temporary exhaustion, even within a strong trend, prompting caution or profit-taking considerations.
- Use in conjunction with volume profiles: A breakout accompanied by strong volume and a wide channel suggests conviction, whereas low volume breakouts are more suspect.
Related Guides
- What Is a State Channel? Off-Chain Transactions Explained
- Lightning Network Setup: How to Open Your First Channel
- What Is Wash Trading in Crypto? Beginner Guide (2026)
- Wash Trading in Crypto: Red Flags Explained
- What Is Trading Volume in Crypto? How to Read It (2026)
Frequently Asked Questions
What is the Keltner Channel indicator?
The Keltner Channel is a volatility based indicator that plots bands above and below a moving average. It uses an exponential moving average for the center line and the Average True Range to set the width of the bands.
How is the Keltner Channel calculated?
The middle line is typically an exponential moving average of price, and the upper and lower bands are set a multiple of the Average True Range away from it. As volatility rises, the bands widen, and as it falls, they narrow.
How do traders use the Keltner Channel?
Traders use it to identify trend direction, spot potential breakouts when price moves outside the bands, and gauge volatility. Price riding the upper band can suggest strength, while moves to the lower band can suggest weakness.
What is the difference between Keltner Channels and Bollinger Bands?
Both create bands around a moving average, but Keltner Channels use the Average True Range to set band width while Bollinger Bands use standard deviation. This can make Keltner Channels appear smoother in some conditions.