Dark AMMs and Hidden Liquidity: Why Some DEX Activity Is Harder to Read
— By Whatsertrade in Tutorials

DEX trading used to feel simple. Traders looked at liquidity, volume, swaps, and price action to understand what was happening in a token's market. But DeFi mar
DEX trading used to feel simple. Traders looked at liquidity, volume, swaps, and price action to understand what was happening in a token's market.
But DeFi market structure is evolving.
New execution models, private liquidity systems, intent-based trading, aggregators, RFQ systems, and dark AMM designs are making some activity harder to read from the surface.
For traders, this creates an important challenge: the market may be more active than it looks, or less healthy than the visible numbers suggest.
This is where the concept of hidden liquidity becomes important.
What Is Hidden Liquidity in DeFi?
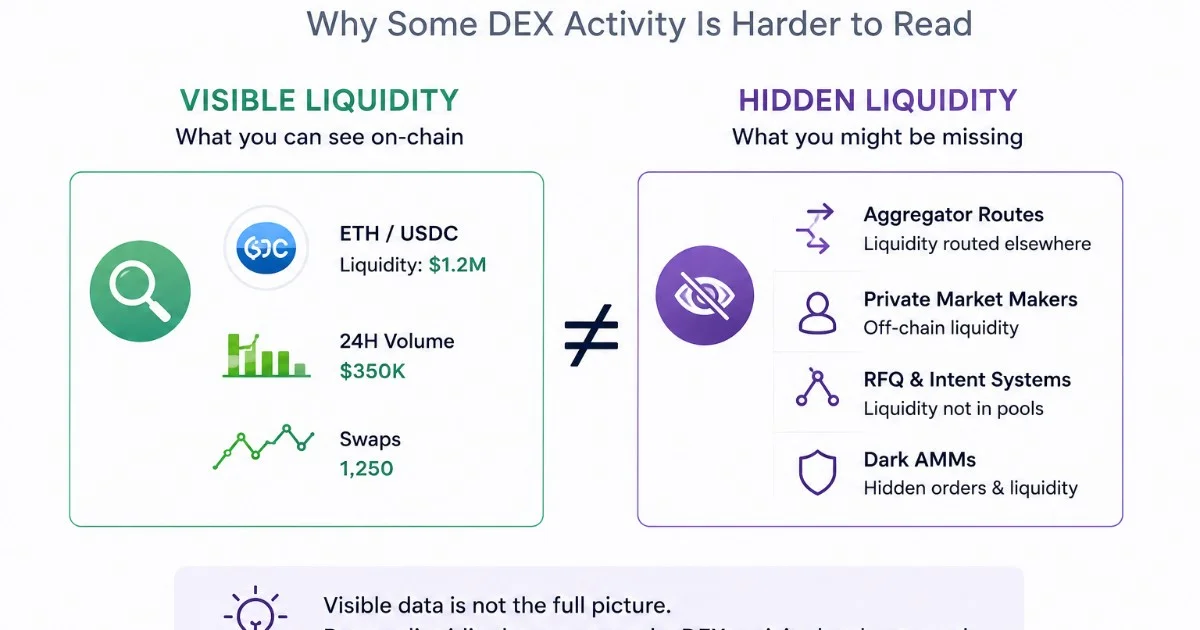
Hidden liquidity refers to liquidity that is not immediately visible in a traditional pool view.
In a standard AMM, liquidity is usually easier to observe. Traders can see the pool, the pair, the total liquidity, the volume, and the swaps.
But in more advanced DeFi systems, liquidity can come from different sources:
- Private market makers
- Aggregator routes
- RFQ systems
- Off-chain liquidity providers
- Intent-based solvers
- Cross-chain liquidity layers
- Dark AMM structures
This means traders may not always see the full picture by looking at one pool.
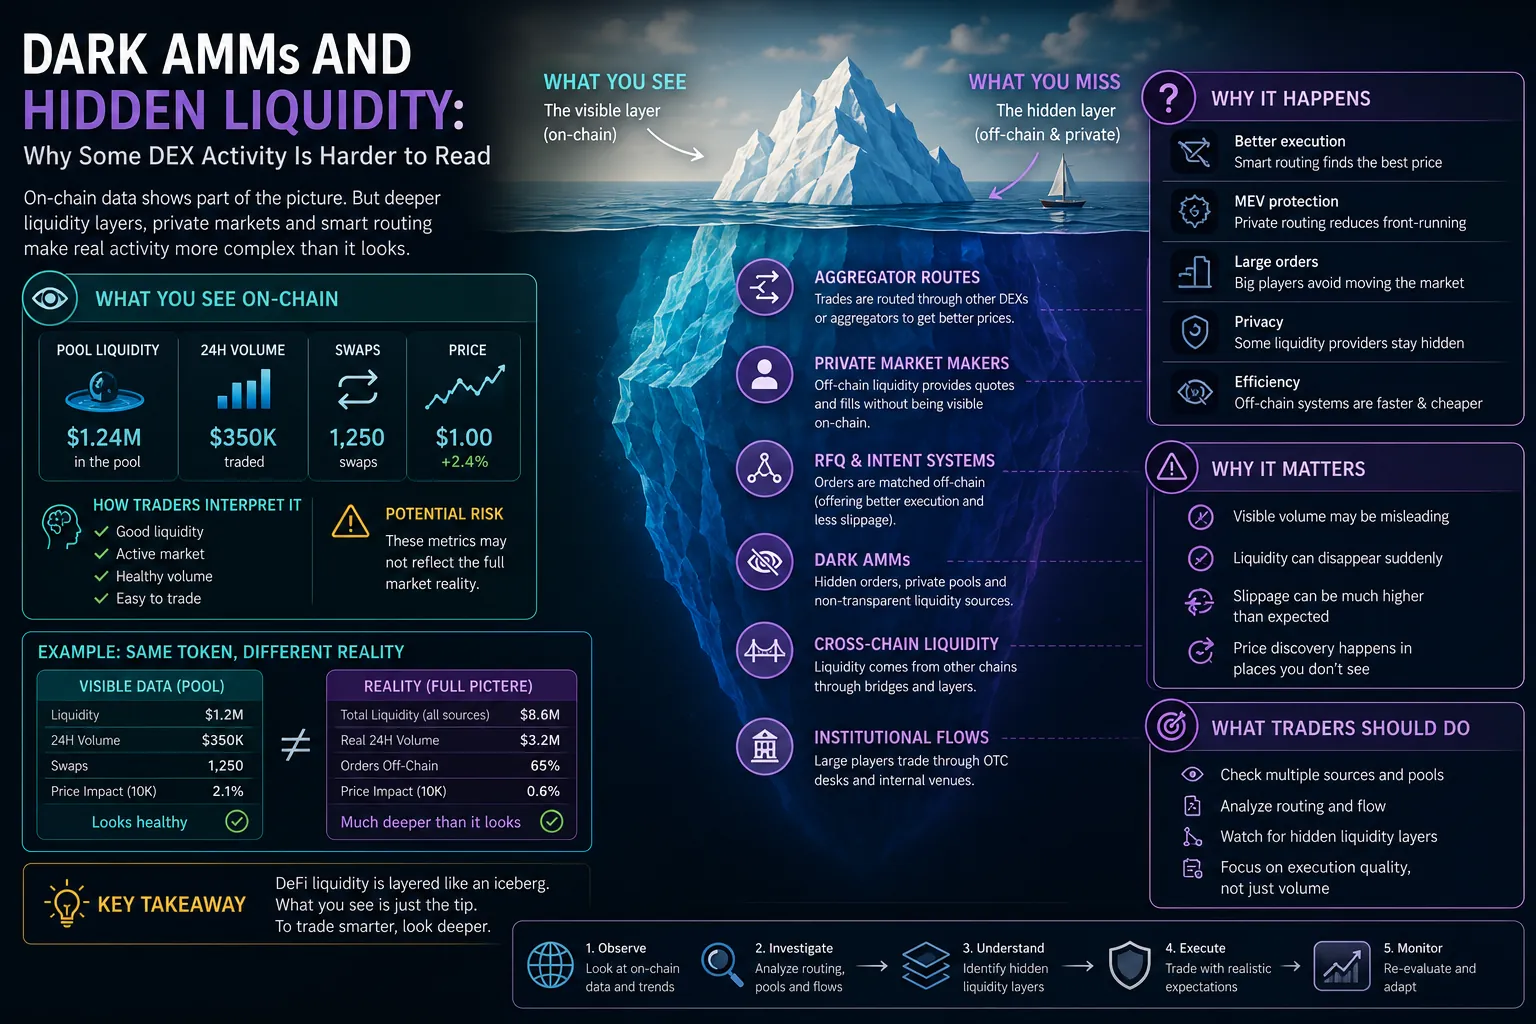
What Are Dark AMMs?
Dark AMMs are trading systems where some liquidity or execution logic is less visible to the public market.
The goal is often to improve execution, reduce MEV, protect users from front-running, or match trades more efficiently.
However, for traders who rely on visible on-chain data, dark AMMs can make market interpretation more complex.
If activity is partially hidden or routed through less transparent systems, simple metrics like visible volume, pool liquidity, or swap count may not tell the whole story.
Why Hidden Liquidity Matters for Traders
Hidden liquidity can change how traders interpret a token's market.
A token may look inactive on one visible pool, but still have strong execution through other liquidity sources. On the other hand, a token may show high visible liquidity, but real execution may depend on external routes or private market makers.
This affects several key trading decisions:
- Is the token liquid enough to enter?
- Can the trader exit without high slippage?
- Is the visible chart showing real demand?
- Is price discovery happening in the pool being watched?
- Are large trades affecting the market more than expected?
When liquidity is fragmented or partially hidden, the visible chart becomes only one part of the analysis.
Why Volume Can Become Misleading
Volume is one of the most watched metrics in crypto trading. But when liquidity is routed through multiple systems, volume can be harder to interpret.
A visible DEX pool may show low volume, while aggregators are routing trades elsewhere. Another pool may show high volume, but that activity may not represent organic demand.
Traders should avoid assuming that volume always means strength.
Instead, they should ask:
- Where is the volume coming from?
- Is the same pool handling most trades?
- Are large trades moving price too much?
- Is volume supported by liquidity?
- Are buyers returning after pullbacks?
Healthy volume should create better price discovery, not just noise.
Hidden Liquidity vs Fake Liquidity
Hidden liquidity and fake liquidity are not the same.
Hidden liquidity means liquidity may exist outside the most obvious pool or visible interface. Fake liquidity means the market looks active or deep but does not support real trading quality.
The difference matters.
Hidden liquidity can improve execution if it is real and accessible. Fake liquidity creates false confidence and can trap traders in poor markets.
The key is to focus on execution quality, not just headline numbers.
Signs That a Market Is Harder to Read
Traders should be cautious when market signals do not match each other.
Warning signs include:
- High liquidity but poor execution
- Strong visible volume but weak price movement
- Price gaps between pools or routes
- Large trades causing unexpected slippage
- Low visible activity but strong market attention
- Aggregator routes avoiding the main pool
- Chart movement that does not match broader demand
These signs do not always mean something is wrong, but they suggest the trader should look deeper.
How Traders Can Adapt
As DEX liquidity becomes more complex, traders need to move beyond basic pool analysis.
A better workflow includes:
- Compare all major pools for the token
- Check whether aggregators route through the visible pool
- Review slippage for realistic trade sizes
- Watch how large swaps affect price
- Look for price gaps across venues
- Track whether liquidity is growing or fading
- Avoid relying on a single chart
The goal is not to know every technical detail behind every execution system. The goal is to understand whether the market supports reliable trading.
Final Thoughts
DeFi is becoming more advanced, and DEX liquidity is no longer always simple to read.
Dark AMMs, hidden liquidity, private routing, and aggregator systems can improve execution, but they can also make market analysis harder.
For traders, the lesson is clear: visible liquidity is useful, but it is not always the full market.
Before entering a trade, focus on execution, slippage, price impact, and where real activity is happening.
In modern DeFi, the best traders do not just follow the chart. They follow the liquidity behind the chart.
How to Read On-Chain Data: Metrics, Wallet Flows and Dashboards (2026) What Is Chain Abstraction: The End of Bridging in Crypto (2026) How to Buy Memecoins Safely: Avoiding HoneypotsFrequently Asked Questions
What are dark AMMs?
Dark AMMs are automated market makers that operate with mechanisms designed to obscure or delay the visibility of trade orders and liquidity to the broader market. This can involve private order books or delayed transaction broadcasting.
How do dark AMMs hide liquidity?
They hide liquidity by not immediately broadcasting all order book information or available liquidity to public blockchain explorers or market data feeds. This can prevent front-running or large orders from immediately impacting market prices.
Why would traders use dark AMMs?
Traders might use dark AMMs to execute large orders without significant price slippage or to avoid being front-run by arbitrage bots. It offers a way to trade with less immediate market impact.
What are the risks associated with dark AMMs?
Risks include potential for less transparency, increased counterparty risk if not properly decentralized, and the possibility of regulatory scrutiny due to their opaque nature. Users may have less insight into the true market depth.
Are dark AMMs legal?
The legality of dark AMMs depends on the specific jurisdiction and their compliance with local financial regulations, particularly concerning market transparency and anti-money laundering. Their regulatory status is still evolving.
Related Guides
- RWA Liquidity Quality: Why Tokenized Assets Can Be Real but Still Hard to Trade
- Dead Liquidity: Why Some Pools Look Alive but Are Practically Untradeable
- Airdrop Farmers vs Real Users: How to Read On-Chain Activity
- Median Trade Size vs Trade Count: Why Small Swaps Can Inflate DEX Activity
- Whale Buy or Exit Liquidity? How to Read Big Swaps Without Blindly Copying Whales