Bitcoin Dominance (BTC.D) Explained: How Traders Read Rotation (2026)
— By Tony Rabbit in Tutorials

Bitcoin dominance explained for traders: what BTC.D measures, how to read it as a market-rotation ratio, the four BTC price vs dominance scenarios, and why it is a regime filter rather than a full altseason guide.
Bitcoin dominance is one of those numbers traders quote constantly without always agreeing on what it means. It is not a price, not a portfolio metric, and not a prediction. It is a ratio that describes how much of the total crypto market belongs to Bitcoin at any given moment. When that number rises, capital is rotating toward Bitcoin. When it falls, capital is rotating toward altcoins. Reading it correctly changes how an entire portfolio is managed.
Quick answer: Bitcoin dominance, often shown as BTC.D, is the percentage of the total crypto market capitalization held by Bitcoin. If the total crypto market is worth $3 trillion and Bitcoin is worth $1.5 trillion, BTC dominance is 50 percent. Traders use it to read capital rotation between Bitcoin and altcoins, not to predict price levels directly.
- BTC.D is a ratio, not a price. It can rise even while Bitcoin's USD price falls, if altcoins fall harder.
- Rising dominance often pressures altcoins. Even strong projects bleed against BTC during dominance up-trends.
- Falling dominance signals altcoin rotation. Capital is flowing into ETH, large-caps, then mid and small caps.
- Stablecoins distort the picture. Some dominance charts include them, others exclude them, and the readings differ.
- It works as a regime filter, not a timing tool. Use it to decide what to trade, not exactly when to trade it.
Intent split
- This page is the BTC.D ratio guide: what the dominance number measures and how traders use it as a rotation filter.
- For the broader altcoin-cycle regime, read What Is Altseason?.
- For the base category definition, read What Is an Altcoin?.
What Bitcoin dominance actually measures
Bitcoin dominance is calculated by dividing Bitcoin's market capitalization by the total market capitalization of all cryptocurrencies, then expressing the result as a percentage. The formula is straightforward: BTC market cap divided by total crypto market cap, multiplied by 100. Most data providers update this number in real time across thousands of assets.
What that single number captures is the relative importance of Bitcoin inside the asset class. When dominance is at 60 percent, every $1 in crypto contains 60 cents of Bitcoin and 40 cents of everything else. When dominance is at 40 percent, the picture is different: Bitcoin is still the largest single asset, but the rest of the market combined is now larger than Bitcoin alone.
How market capitalization is calculated
Market cap is the asset's circulating supply multiplied by its current price. Bitcoin has a relatively predictable issuance schedule, so BTC market cap moves mostly with price. Altcoin market caps move with both price and supply changes (token unlocks, new emissions, burns), which means their share of the total can shift even when individual prices barely move.
This matters because a sudden token unlock on a major altcoin or a new high-FDV listing can change dominance metrics without a single trader changing positions. Reading dominance correctly means understanding that the denominator is alive, not static.
Why dominance is a ratio, not a price prediction
Bitcoin dominance can rise during a bull market, fall during a bull market, rise during a bear market, and fall during a bear market. The number does not tell a trader whether prices are going up or down in dollar terms. It tells the trader where the marginal capital is going inside the asset class.
A simple way to remember it: BTC.D is about relative performance. If Bitcoin is up 5 percent and altcoins are flat, dominance rises. If both fall but altcoins fall harder, dominance also rises. The same number can describe very different market conditions, which is why traders pair dominance with the absolute price chart of BTC.

How to read the BTC dominance chart
The dominance chart is best read in three layers: the long-term trend, the medium-term regime, and the short-term shift. Most traders skip the first two and try to read short-term moves only, which is why dominance signals so often look noisy.
Long-term trend
On the multi-year view, dominance has trended down from near 100 percent in Bitcoin's early days to roughly 40 to 60 percent over the last several cycles. That long arc reflects the growth of the broader crypto ecosystem: stablecoins, Ethereum, Solana, layer-2 networks, real-world-asset tokens, and thousands of altcoins all eating share over time.
Reading the long-term chart should anchor expectations. Dominance is unlikely to return to 80 or 90 percent without an extreme market event, and it is unlikely to fall to 10 percent without a structural change in how crypto markets work. Most cycles play out inside a band, not at the extremes.
Medium-term regime
Inside the long-term band, dominance moves in regimes that often last weeks to months. A sustained dominance up-trend is a "Bitcoin season": capital flows into BTC and most altcoins underperform even when their charts look neutral. A sustained down-trend is "altseason territory": altcoins outperform on a rotation basis, even if BTC itself is also rising.
Recognizing the regime matters more than calling individual swings. A trader holding altcoins inside a long dominance up-trend is fighting the current. A trader chasing BTC during a clear dominance breakdown is missing where the marginal money is going.
Short-term shifts
Short-term, dominance often reverses sharply around news events: ETF flows, regulatory headlines, large CEX listings. These moves can mean little for the structural regime. Reading them as "altseason is starting" or "Bitcoin season is back" based on a single weekly candle is the most common beginner mistake on the dominance chart.
Dominance vs Bitcoin price: four scenarios
The cleanest way to use dominance is to combine it with the BTC USD price. The four possible combinations describe most of what happens in crypto markets.
| BTC price | BTC dominance | Most likely regime |
|---|---|---|
| Up | Up | Bitcoin season inside a bull market - alts underperform |
| Up | Down | Altseason expansion - alts outperform Bitcoin |
| Down | Up | Risk-off rotation - alts bleed harder than BTC |
| Down | Down | Macro-led sell-off - capital leaves the asset class entirely |
This grid is more useful than any single dominance reading. The same 55 percent dominance can be a healthy Bitcoin season or the start of a deep correction depending on what BTC USD is doing in parallel.
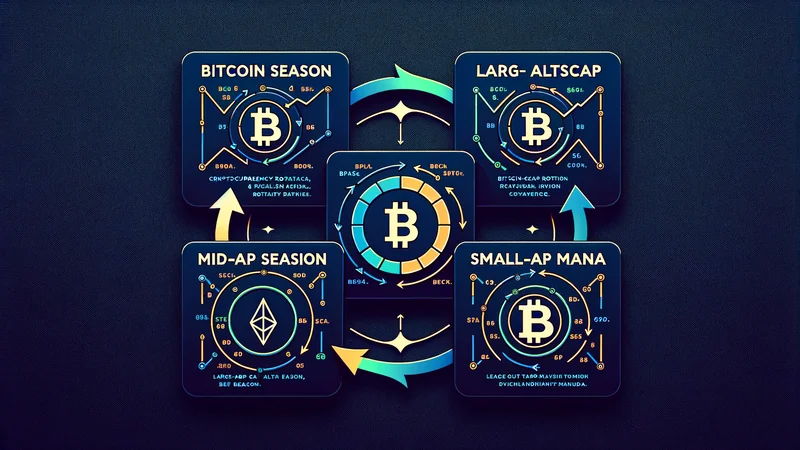
The capital rotation cycle in plain English
One of the most repeated patterns in crypto cycles is the four-stage rotation. Capital does not enter all coins at the same time. It moves from Bitcoin to large-cap altcoins, then to mid-caps, then to small-caps and meme coins, before reversing back toward Bitcoin and stablecoins when risk appetite drops.
Stage 1: Bitcoin leads
Early in a recovery, capital concentrates in Bitcoin. Dominance rises. Altcoins look weak even when BTC is breaking out. Many traders make the mistake of buying alts here because "they have more upside," and they spend weeks watching BTC pull ahead.
Stage 2: Ethereum and large-caps catch up
Once Bitcoin's move is recognized, capital starts rotating into ETH and other top-10 assets. ETH/BTC begins to trend up. Large layer-1 and layer-2 tokens follow. Dominance flattens or starts ticking down.
Stage 3: Mid and small caps
The classic "altseason" phase appears when the rotation reaches mid and small caps. Dominance falls visibly. Sector narratives (DeFi, AI, RWA, memes) take turns leading. Volatility expands and so does drawdown risk.
Stage 4: Reversion
At the end of the cycle, narrowness returns. Capital rotates back toward stablecoins and Bitcoin as risk appetite cools. Dominance rises sharply, often catching late altcoin buyers wrong-footed. Recognizing this stage early is one of the highest-value uses of the dominance chart.
The stablecoin trap in dominance readings
Different data providers calculate dominance slightly differently, and the biggest variable is how they treat stablecoins. Some include them in the total crypto market cap, which dilutes Bitcoin's share. Others exclude them, which makes the BTC ratio look higher.
Both versions have a use. Including stablecoins shows where total dollars sit in the asset class. Excluding them shows the volatile, "risk on" subset of crypto and how Bitcoin compares to other risk assets. A reading of 55 percent on one chart can be 60 percent on another for the exact same moment in time. When comparing dominance levels across sources, always confirm the methodology first.
How traders actually use dominance
Dominance is most useful as a regime filter that decides what kind of trades to look for, not as a timing signal that decides exactly when to enter.
- Bias selection. Rising dominance favors BTC longs and short alt-vs-BTC pairs. Falling dominance favors alt longs and long alt-vs-BTC pairs.
- Position sizing. In a clear dominance up-trend, sizing into altcoins is reduced because the ratio is fighting the trade.
- Sector rotation. A persistent dominance breakdown often coincides with a leadership change among altcoin sectors (L2s, AI, memes), worth tracking with separate sector indices.
- Risk-off filter. Sharp dominance spikes during BTC drawdowns are an early warning that the market is rotating to safety inside crypto.
Pair it with on-chain data and structure tools. Candlestick reading, on-chain data, and fundamental analysis answer the questions dominance does not.
Common mistakes when reading BTC dominance
- Using dominance to predict BTC price. The two move independently more often than beginners expect.
- Ignoring methodology. Comparing dominance levels from different providers without checking how stablecoins are treated.
- Reading a single candle. One day or one week is rarely enough to declare a regime change.
- Trading dominance directly. Most retail traders cannot trade BTC.D as a clean instrument; they end up trading alt-vs-BTC pairs and confusing the two.
- Calling altseason on the first dip. Real altseasons usually require sustained dominance breakdowns, not just a few percentage points lower.
Frequently asked questions
What is a healthy Bitcoin dominance level?
There is no fixed "healthy" level. Different cycles have settled at different ranges. Most modern cycles have oscillated between roughly 40 and 65 percent. The level matters less than the direction and the slope.
Does Bitcoin dominance include stablecoins?
It depends on the data provider. Some include stablecoins in the total market cap, others exclude them. The same dominance moment can read differently across charts. Always confirm methodology when comparing sources.
Can BTC dominance go above 100 percent?
No. The ratio is bounded between 0 and 100 percent because Bitcoin is one component of the total crypto market cap. In Bitcoin's early days, dominance approached 100 percent because there were almost no other tradeable cryptocurrencies.
Is rising dominance always bad for altcoins?
Almost always, on a relative basis. Even when altcoins rise in dollar terms during a dominance up-trend, they typically underperform Bitcoin. Pure-play altcoin traders feel this as "everything pumps less than BTC." Multi-asset portfolios feel it as "BTC is doing the work."
How do I track Bitcoin dominance live?
Most major data providers (TradingView, CoinMarketCap, CoinGecko) publish a live BTC.D chart. The TradingView ticker is usually CRYPTOCAP:BTC.D. For a stablecoin-excluded version, look for tickers like BTC.D excluding USDT and USDC, or compute it manually from the published values.
Final takeaway: Bitcoin dominance is not a magic indicator. It is a relative-share metric that, used with the BTC price chart, describes how capital rotates inside crypto. Read it for regime, not for timing, and combine it with structure and on-chain tools before changing portfolio bias.
Disclaimer: This guide is for educational purposes only and does not constitute investment, financial, legal, or trading advice. Market dominance metrics can shift quickly and past behavior does not guarantee future outcomes.
Related Guides
- Chain Rotation: How Traders Detect Liquidity Moving Between Ecosystems
- What Is Wrapped Bitcoin (WBTC)? Uses, Risks and WBTC vs BTC (2026)
- What Is Babylon Bitcoin Staking: Complete BTC Self-Custody Staking Guide (2026)
- BTC to USD: Live Bitcoin Price and Conversion Guide 2026
- How to Use Glassnode: Read Bitcoin On-Chain Metrics Better (2026)
Frequently Asked Questions
What is Bitcoin dominance (BTC.D)?
Bitcoin dominance measures Bitcoin's share of the total cryptocurrency market capitalization, expressed as a percentage. It shows how much of the market's value sits in Bitcoin versus all other coins combined.
How do traders use Bitcoin dominance?
Traders read BTC.D as a rotation gauge, watching whether capital is favoring Bitcoin or flowing into altcoins. It is typically used as one input among many, not a standalone trading signal.
Does rising Bitcoin dominance mean altcoins are falling?
Rising dominance means Bitcoin is gaining market share relative to altcoins, which often coincides with altcoins underperforming, though prices can still move in either direction. It is a relative measure, not an absolute price.
What is an altcoin season?
An altcoin season is a period when altcoins broadly outperform Bitcoin, often associated with falling Bitcoin dominance. It reflects capital rotating from Bitcoin into other crypto assets.