How to Use Glassnode: Read Bitcoin On-Chain Metrics Better (2026)
— By Tony Rabbit in Tutorials

Learn how to use Glassnode to read Bitcoin on-chain metrics, supply trends and market cycle indicators with more confidence in 2026.
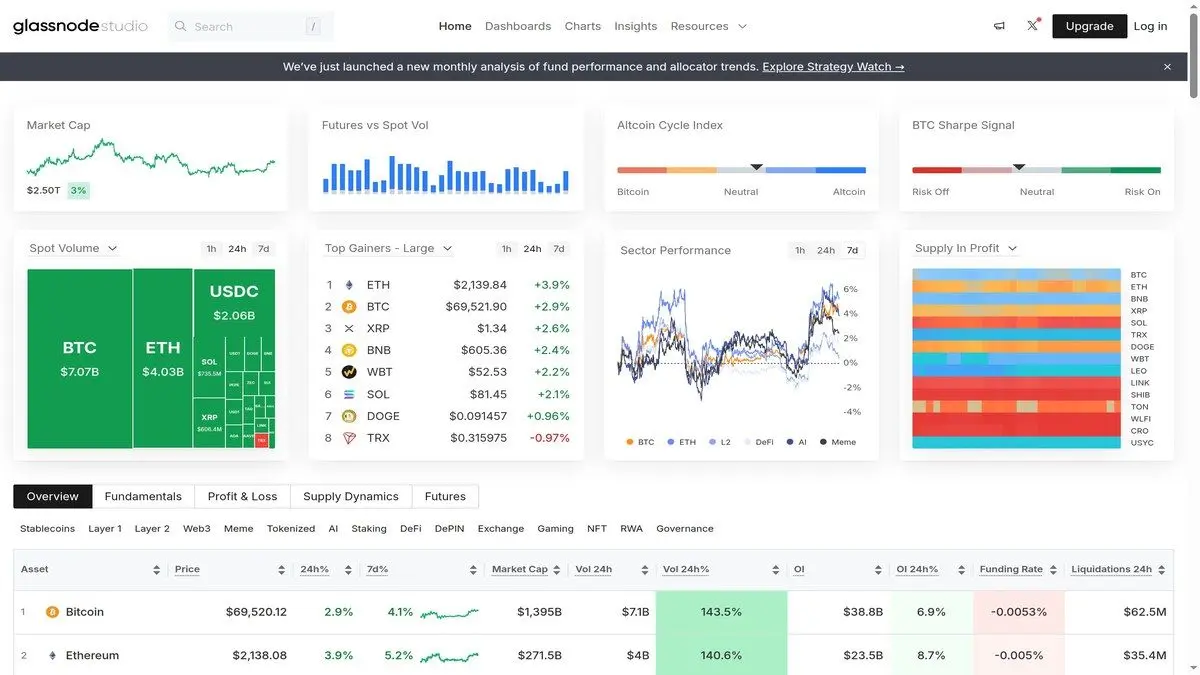
Glassnode is one of the best tools for understanding what is happening underneath Bitcoin price action. It is not built for fast trading signals in the same way a screener or order flow tool is. It is built for on-chain context: supply behavior, holder positioning, exchange balances, and market cycle indicators that help explain whether the market is overheating, resetting, or strengthening.
That makes Glassnode especially useful when the market gets noisy. Headlines move fast. Narratives flip every day. On-chain data helps slow the process down and ask a better question: what are holders, coins and flows actually doing?
What Glassnode Is Best At
- Tracking Bitcoin supply trends and holder behavior
- Watching exchange balances and potential sell-side pressure
- Using long-cycle indicators to frame macro conditions
- Separating emotional price narratives from on-chain reality
Why Glassnode matters in 2026
Bitcoin is more widely followed than ever, but that also means the market gets flooded with shallow commentary. Glassnode gives you a way to ground your view in measurable network behavior. That does not mean every on-chain chart is automatically predictive. It means you can evaluate market conditions with a better framework than price and sentiment alone.
For serious research, that is valuable. If exchange balances are falling, long-term holder supply is stable, and panic headlines are everywhere, the market may be healthier than it looks. If speculative activity is exploding and cycle indicators are stretched at the same time, upside may be more fragile than the chart alone suggests.
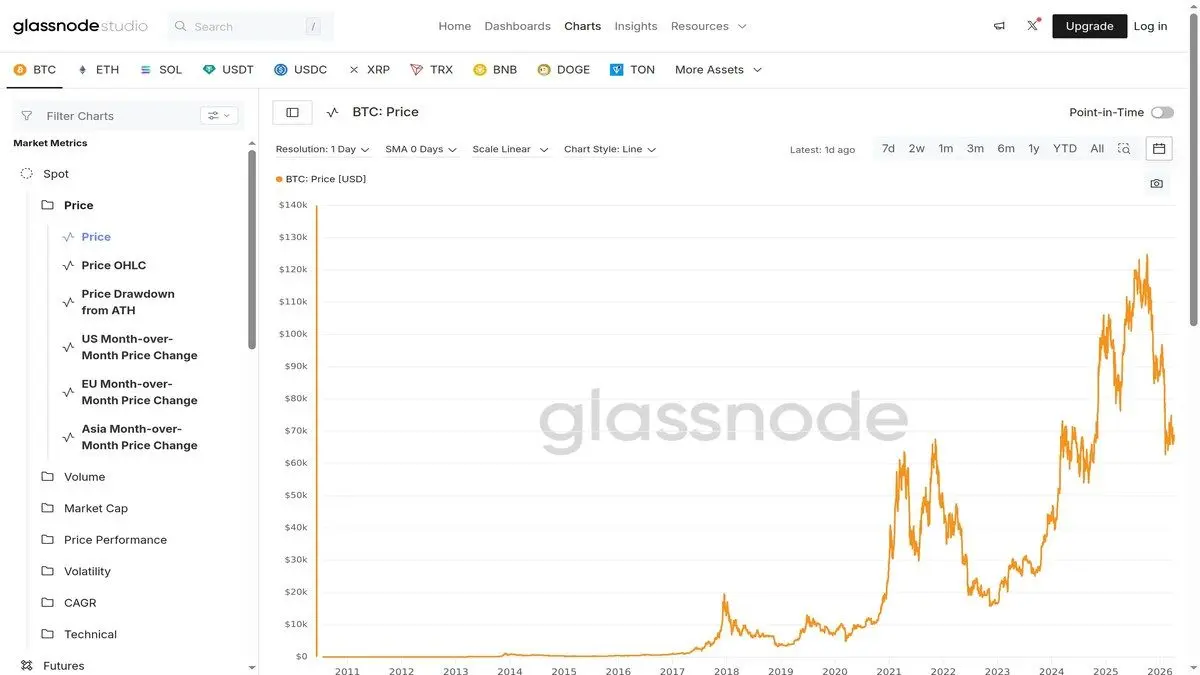
Start with the simple metrics first
The mistake many beginners make is jumping straight into the most exotic chart on the platform. That usually leads to overconfidence and bad interpretation. The better path is to begin with the simplest and most durable on-chain categories: supply, exchange balances, and broad market cycle indicators.
Supply metrics help you understand where coins are sitting and how tightly held they are. Exchange balances help you think about immediate sell-side availability. Market cycle indicators give you context about whether Bitcoin is trading in a historically overheated or depressed regime.
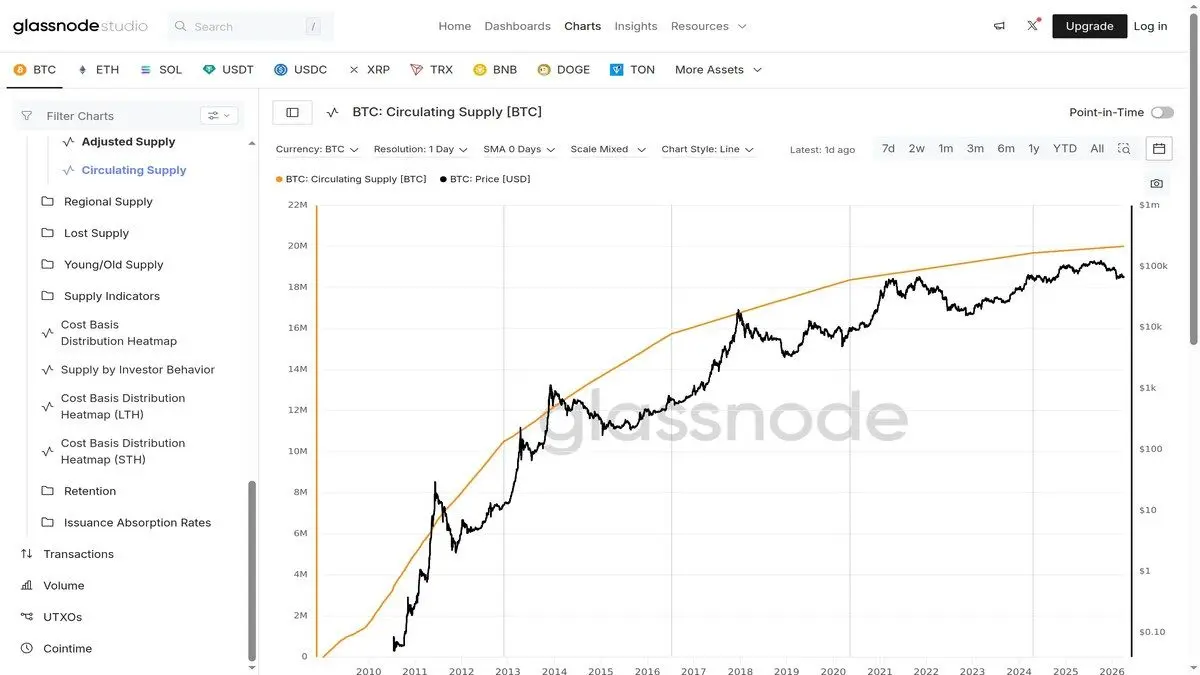
Supply and exchange data are the practical core
If you only use a few Glassnode charts regularly, make them the ones that help you answer practical questions. Are coins leaving exchanges? Is long-term holder supply staying firm? Are liquid balances rising into weakness? Those are the kinds of observations that can change how you interpret market stress.
When exchange reserves decline over time, it often suggests less immediately available supply for selling, though context always matters. When supply metrics start shifting quickly in the other direction, it can hint that holders are getting more willing to move coins or prepare them for sale. These are not perfect signals, but they are useful context.
Use cycle indicators carefully, not literally
One reason Glassnode is respected is that it gives researchers access to long-cycle charts that can frame whether the market is historically extended. But these tools are easy to misuse. They are not countdown clocks to a top or bottom. They are probabilistic context markers.
The right way to use them is to ask whether several indicators are converging toward the same conclusion. If supply data, profitability data, and long-cycle indicators all suggest overheating, that matters. If one flashy chart is screaming top while the rest of the data looks balanced, the signal is weaker.
How Glassnode fits into a broader research stack
Glassnode is strongest when paired with other tools. Use it for Bitcoin and macro on-chain context. Use Dune for custom dashboards and cross-ecosystem analysis. Use DefiLlama for DeFi and stablecoin flows. Use DEXTools when you want to translate high-level context into actual pair-level execution.
This is also why Glassnode is especially helpful in uncertain conditions. When short-term narratives are noisy, on-chain context helps you avoid getting emotionally whipsawed by every headline.
Common mistakes to avoid
- Using one on-chain metric as if it can predict exact tops and bottoms
- Ignoring time horizon and overreacting to short-term moves in long-cycle charts
- Confusing descriptive indicators with guaranteed trade signals
- Reading exchange balance changes without broader context
- Forgetting that on-chain context still needs chart and liquidity confirmation
Frequently Asked Questions
Related Tutorials
Glassnode is worth using because it improves your market framing. It helps you step back from noisy short-term narratives and ask what the chain is really saying. Used that way, it becomes one of the best context tools in crypto research.
Related Guides
- How to Read On-Chain Data: Metrics, Wallet Flows and Dashboards (2026)
- Spot Real Demand vs Frenzy With On-Chain Metrics
- Settlement Volume vs Transfer Count: Which Better Shows Real On Chain Value Movement?
- How to Use Dune Analytics: Build Better Crypto Dashboards and On-Chain Research (2026)
- Bitcoin Dominance (BTC.D) Explained: How Traders Read Rotation (2026)