Stock-to-Flow Bitcoin Model Explained (2026)
— By Tony Rabbit in Tutorials

Stock-to-Flow Bitcoin model explained: understand what it measures, where it breaks down, and how investors use it as a scarcity valuation tool.
This guide focuses on the Stock-to-Flow Bitcoin valuation model, not on general market structure, dominance, or short-term trading signals. It is a valuation-framework page first.
Stock-to-Flow is the most discussed Bitcoin valuation model in history and one of the most misunderstood. It is not a price prediction. It is not a guarantee. It is a scarcity-based framework borrowed from commodity markets and applied to Bitcoin's predictable supply schedule. Understanding what it actually says, and what it does not, is the difference between using S2F as a thinking tool and using it as a horoscope.
Quick answer: The Stock-to-Flow (S2F) model values Bitcoin based on the ratio between its existing supply (stock) and its annual new issuance (flow). The higher the ratio, the scarcer the asset. Created by analyst PlanB and popularized in 2019, S2F gained attention because it modeled Bitcoin's historical price increases against halving events with surprising visual fit. It is best treated as one of several lenses for thinking about Bitcoin scarcity, not as a literal price target.
- S2F is a scarcity ratio. Existing supply divided by annual new supply.
- Halvings cut flow in half. Bitcoin's S2F ratio doubles every four years by design.
- The model is descriptive, not predictive. Past fit does not guarantee future fit.
- It ignores demand entirely. Scarcity alone does not set price; buyers and sellers do.
- Use it as one input. Pair S2F with on-chain flows, macro conditions, and structure.
What Stock-to-Flow actually measures
Stock-to-Flow is a metric originally used in commodity markets to describe the scarcity of assets like gold, silver, and platinum. The formula is simple: divide the total existing supply (stock) by the annual production (flow). Gold has historically had an S2F ratio around 60, meaning it would take roughly 60 years of new mining to recreate the existing supply. Silver sits around 22. The higher the number, the harder it is to flood the market with new supply.
Why the metric exists
Commodities behave very differently when their S2F ratio is high. Gold cannot be doubled overnight. That predictability is part of what makes it a long-term store of value. By contrast, copper has an S2F ratio close to 0.4, meaning new annual supply is comparable to total stock. Copper is consumed, gold is hoarded. The number captures that difference cleanly.
Applying S2F to Bitcoin
Bitcoin's supply schedule is unique among assets: it is fully programmatic. New BTC enters circulation through mining at a known, decreasing rate. Roughly every four years, the block reward halves, cutting new issuance in half. That means Bitcoin's S2F ratio rises mechanically over time. PlanB's insight was that Bitcoin is the first asset whose scarcity can be measured precisely and projected forward, and that the model fit historical price closely.
Why halvings drive S2F so hard
Bitcoin's halving event is the engine of the S2F narrative. Every 210,000 blocks (roughly four years), the block reward miners receive is cut in half. That single rule has profound implications for the supply curve and, by extension, for the S2F ratio.
The mechanics
When the reward halves, annual flow halves with it. If the existing stock barely changes (because issuance was already small relative to supply), the S2F ratio roughly doubles. After four halvings, Bitcoin's S2F ratio has risen from single digits to numbers that sit near or above gold's historical level, which is why proponents call Bitcoin "harder than gold" in scarcity terms.
The historical pattern
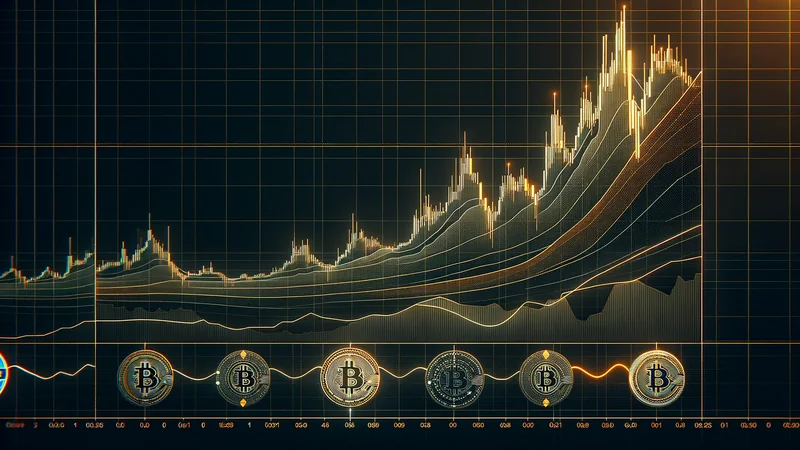
Each Bitcoin halving has been followed, with a lag, by a major price expansion: 2012, 2016, 2020, and 2024. The pattern is real and visible on the chart. Whether the cause is scarcity, narrative, capital flows, or all three together is where serious analysts disagree. S2F captures the scarcity piece, but the chart's recurring rallies after halvings are not proof that S2F is the cause; they are correlated, and correlation is not causation.
What the model gets right
Critics and supporters often miss what S2F actually does well. The model has at least three contributions that hold up regardless of whether the price trajectory continues to track it.
It quantifies scarcity
S2F is a clean way to express scarcity in a single number. It removes vibes from the conversation. "Bitcoin is scarce" becomes "Bitcoin's stock-to-flow is X, comparable to gold's historical Y." That is a meaningful upgrade in precision over qualitative arguments.
It frames halvings cleanly
By tying scarcity directly to halvings, S2F makes the four-year cycle legible. Even traders who reject the model's specific price predictions often use the halving cadence as a structural input for portfolio planning.
It started a useful debate
S2F forced the entire crypto industry to talk about supply economics seriously. Counter-models, criticisms, and refinements all came out of the conversation S2F started, which is part of why supply-side analysis is so much more developed today than in 2018.
What the model gets wrong (or ignores)
The criticisms of S2F are also real and deserve airtime.
It ignores demand entirely
Scarcity is necessary but not sufficient for value. An asset can be perfectly scarce and still trade at zero if no one wants it. S2F assumes demand grows with each cycle, which is a hidden assumption built into the historical fit. There is no guarantee that demand continues to scale forever.
It is fitted to past data
The S2F model was calibrated on historical Bitcoin data. Models calibrated on past data tend to fit past data. The real test is out-of-sample performance, and S2F's price targets for recent cycles have at times diverged significantly from realized prices. Defenders argue cycles are messy. Critics argue the model is not falsifiable.
It does not handle macro shocks
S2F has no input for interest rates, regulation, ETF flows, or macro liquidity, all of which obviously affect Bitcoin's price. A model that ignores half the inputs of a complex system cannot be expected to predict that system precisely.
It assumes static behavior
S2F's simplest version assumes participants behave the same way around every halving. Markets do not work that way. Each cycle has different leverage profiles, different participant compositions (retail in 2017, institutions and ETFs by 2024), and different global macro backdrops.

Bitcoin S2F vs gold and silver
| Asset | Approx. S2F ratio | Notes |
|---|---|---|
| Copper | ~0.4 | Industrial commodity, mostly consumed. |
| Silver | ~22 | Half store of value, half industrial. |
| Gold | ~60 | Historical reference for monetary scarcity. |
| Bitcoin (post-2024 halving) | >110 | Programmatic, doubles every halving. |
The headline is straightforward: Bitcoin's mathematical scarcity now exceeds gold's. Whether the market prices that scarcity at the levels S2F implies is a separate, much harder question.
How traders and investors actually use S2F
Used responsibly, S2F is a thinking tool, not a forecast. Three honest uses cover most of what serious investors do with it.
1. As a long-term context anchor
Position-sizing and rebalancing decisions for long-term holders often consider where price sits relative to S2F. A price far below the S2F line might suggest accumulation territory; a price far above might suggest profit-taking. The model is a context, not a buy/sell button.
2. As a halving-cycle framework
Even traders who do not believe S2F's price targets often plan around its four-year cadence. Pre-halving accumulation, post-halving expansion, and end-of-cycle distribution are real patterns regardless of whether S2F is the explanation.
3. As an input alongside other models
Pair S2F with metrics like realized cap, MVRV, exchange balances, and ETF flows. On-chain data, Bitcoin dominance, and macro liquidity all add color that S2F alone cannot. Stacking imperfect models often beats trusting any single one.
Common Stock-to-Flow mistakes
- Treating S2F price targets as guarantees. They are extrapolations from past fit, not forecasts.
- Ignoring demand. Scarcity without buyers is just dust.
- Assuming linearity. Each cycle has different macro and participant conditions.
- Trading short-term off S2F. The model is a multi-year framework, useless for intraday or weekly decisions.
- Dismissing it entirely. The opposite mistake. S2F still captures something real about programmatic scarcity.
A practical workflow for using S2F
- Look at S2F as one of several lenses, not the only one. Pair it with on-chain, macro, and structural reads.
- Use halving cadence for position planning. Pre-halving accumulation, post-halving rebalancing.
- Be skeptical of exact price targets. The model's strength is regime, not precision.
- Cross-check with BTC dominance and altseason context. Bitcoin's cycle drives most of crypto's behavior.
- Stay flexible. If macro shifts dramatically (rates, regulation, adoption), S2F's signal weakens further.
Frequently asked questions
Who created the Stock-to-Flow model?
The pseudonymous analyst PlanB introduced the Bitcoin S2F model in 2019. Earlier, more general S2F frameworks existed in commodity analysis. PlanB's contribution was applying the metric specifically to Bitcoin and showing the historical price fit.
Is the Stock-to-Flow model still relevant in 2026?
It remains a useful framework for thinking about Bitcoin's programmatic scarcity, but its precision as a price predictor has been challenged in recent cycles. Most serious analysts now use S2F as one input among several rather than as a primary forecast.
Does S2F apply to other cryptocurrencies?
It can be calculated for any asset with a defined supply schedule, but its meaning depends on how predictable that supply is. Ethereum's post-Merge supply is dynamic and influenced by usage, which makes S2F less informative for ETH than for BTC. Most altcoins have inflation schedules that change too often for S2F to be useful.
What was wrong with S2F in the last cycle?
Critics point out that S2F's projected price targets after the 2020 halving overshot realized prices significantly during parts of the cycle. Defenders argue the model captures regime, not exact peaks, and that broader macro conditions (interest rates, regulation) compressed the cycle. The honest answer is that both points have merit.
Can I use S2F for short-term trading?
No. S2F is a multi-year framework and is not designed for intraday, weekly, or even monthly decisions. Using it for short-term timing creates noise without signal.
Final takeaway: Stock-to-Flow is a serious framework for thinking about Bitcoin scarcity, not a magic price oracle. Its strength is in describing programmatic supply economics; its weakness is everything outside supply (demand, macro, regulation). Treat it as one durable input into a long-term thesis, pair it with other models, and you get most of its value with none of the embarrassment of confusing it for a forecast.
Disclaimer: This guide is for educational purposes only and does not constitute investment, financial, legal, or trading advice. Valuation models are simplifications of complex systems and should never be used as standalone investment decisions.
Related Guides
- What is Internet Computer (ICP)? Reverse Gas Model Explained
- Crypto DCA Calculator: Model Recurring Buys and Current Value (2026)
- What Is Order Flow in Crypto Trading? How to Read Buying and Selling Pressure (2026)
- What Is FDV in Crypto? Fully Diluted Valuation Explained (2026)
- The Market Cap Mirage: Why Token Valuation Means Little Without Depth
Frequently Asked Questions
What is the Stock-to-Flow model in Bitcoin?
Stock-to-Flow is a scarcity model that compares the existing supply of an asset (stock) to the amount newly produced over a period (flow). For Bitcoin, a higher ratio is interpreted as greater scarcity, which the model frames as a driver of value.
How does Stock-to-Flow apply to Bitcoin halvings?
Bitcoin halvings cut the rate of new coin issuance roughly in half on a fixed schedule, which lowers the flow and raises the Stock-to-Flow ratio. The model uses these events to argue that scarcity increases step by step over time.
Why is the Stock-to-Flow model criticized?
Critics argue that scarcity alone does not determine price, since demand, regulation, liquidity, and market sentiment also matter. The model can also overfit past data and may break down when actual prices diverge sharply from its projections.
Should I use Stock-to-Flow to predict Bitcoin price?
Stock-to-Flow is best treated as one conceptual lens on scarcity rather than a precise price forecast. Most analysts combine it with other indicators and risk management instead of relying on any single model.