What Is FDV in Crypto? Fully Diluted Valuation Explained (2026)
— By Tony Rabbit in Tutorials
What is FDV in crypto? Learn the definition, formula, FDV-to-market-cap relationship, unlock logic, and why fully diluted valuation matters before buying a token.
Intent check: This page is the definition-first explainer for FDV itself. If you want the practical comparison angle between FDV and market cap before token unlocks, read FDV vs Market Cap in Crypto.
Fully diluted valuation, almost always abbreviated as FDV, is probably the most misunderstood number on every crypto data dashboard. It sits right next to the market cap on CoinGecko, CoinMarketCap, and DEXTools, often three to twenty times larger, and most retail traders either ignore it completely or treat it as a meaningless theoretical figure. Both reactions are wrong, and that misunderstanding has cost the average crypto buyer more money in the last two years than almost any other knowledge gap.
The reason FDV matters so much in 2026 is the low-float launch problem that defined the 2024 and 2025 token cycles. Project after project came to market with a tiny percentage of supply circulating, an enormous fully diluted valuation pinned to that thin float, and then collapsed under the weight of cliff unlocks and linear vesting waterfalls. If you bought any of these tokens at TGE without looking at FDV, you were not buying a project. You were buying a sliver of inflation that was guaranteed to grow.
This guide explains FDV in plain English, gives you the formula, compares it across major 2026 tokens with real ratios, explains how to find it on every major data platform, and shows you exactly when it tells the truth and when it lies. By the end you will have a mental framework that puts you ahead of 95% of retail crypto buyers who still think market cap is the only number that matters.
What Is FDV in Crypto?
Fully diluted valuation is the theoretical market capitalization a token would have if every single unit of its max supply were already circulating at the current market price. It answers a simple question: if every token that will ever exist were unlocked and trading right now, what would the project be worth? The formula is straightforward, but the implications are anything but.
Compare that with regular market cap. Market cap uses circulating supply, which is the number of tokens currently in the hands of the public and freely tradable. FDV uses max supply, the absolute cap of how many tokens can ever exist according to the protocol's rules. The difference between those two numbers is your future inflation, your future sell pressure, and very often the difference between a sustainable bet and a slow-motion bleed.
This concept is intimately tied to a project's tokenomics, the rules that govern how tokens are created, distributed, and emitted over time. You cannot understand FDV without understanding tokenomics, and you cannot evaluate tokenomics without computing FDV.
FDV vs Market Cap vs Total Supply
Before you can use FDV intelligently, you need to keep three supply numbers straight in your head, because they are constantly confused with each other on Twitter, in pitch decks, and even in some data dashboards.
Circulating supply is the number of tokens actually in public hands, freely tradable, with no lockup. Tokens held by the team in a vesting contract do not count. Tokens reserved for future emissions do not count. Burned tokens do not count. Only what the market can buy and sell today.
Total supply is circulating supply plus all tokens that exist but are not yet liquid. Locked team tokens, unvested investor allocations, and treasury reserves all sit inside total supply. Burned tokens are excluded because they are gone forever, but anything that is still held by the protocol or its insiders is included.
Max supply is the absolute ceiling defined by the smart contract or protocol rules. For Bitcoin it is 21 million, hard-coded. For many ERC-20 tokens it is set in the contract constructor and cannot be increased. For some inflationary tokens like ETH or DOGE there is no max supply because the protocol mints new units forever, which is exactly why FDV breaks down in those cases. We will come back to that.
The relationship is simple: circulating ≤ total ≤ max. Market cap uses the first. FDV uses the third. The gap between those two is what you are buying when you accept the current price of a low-float token.
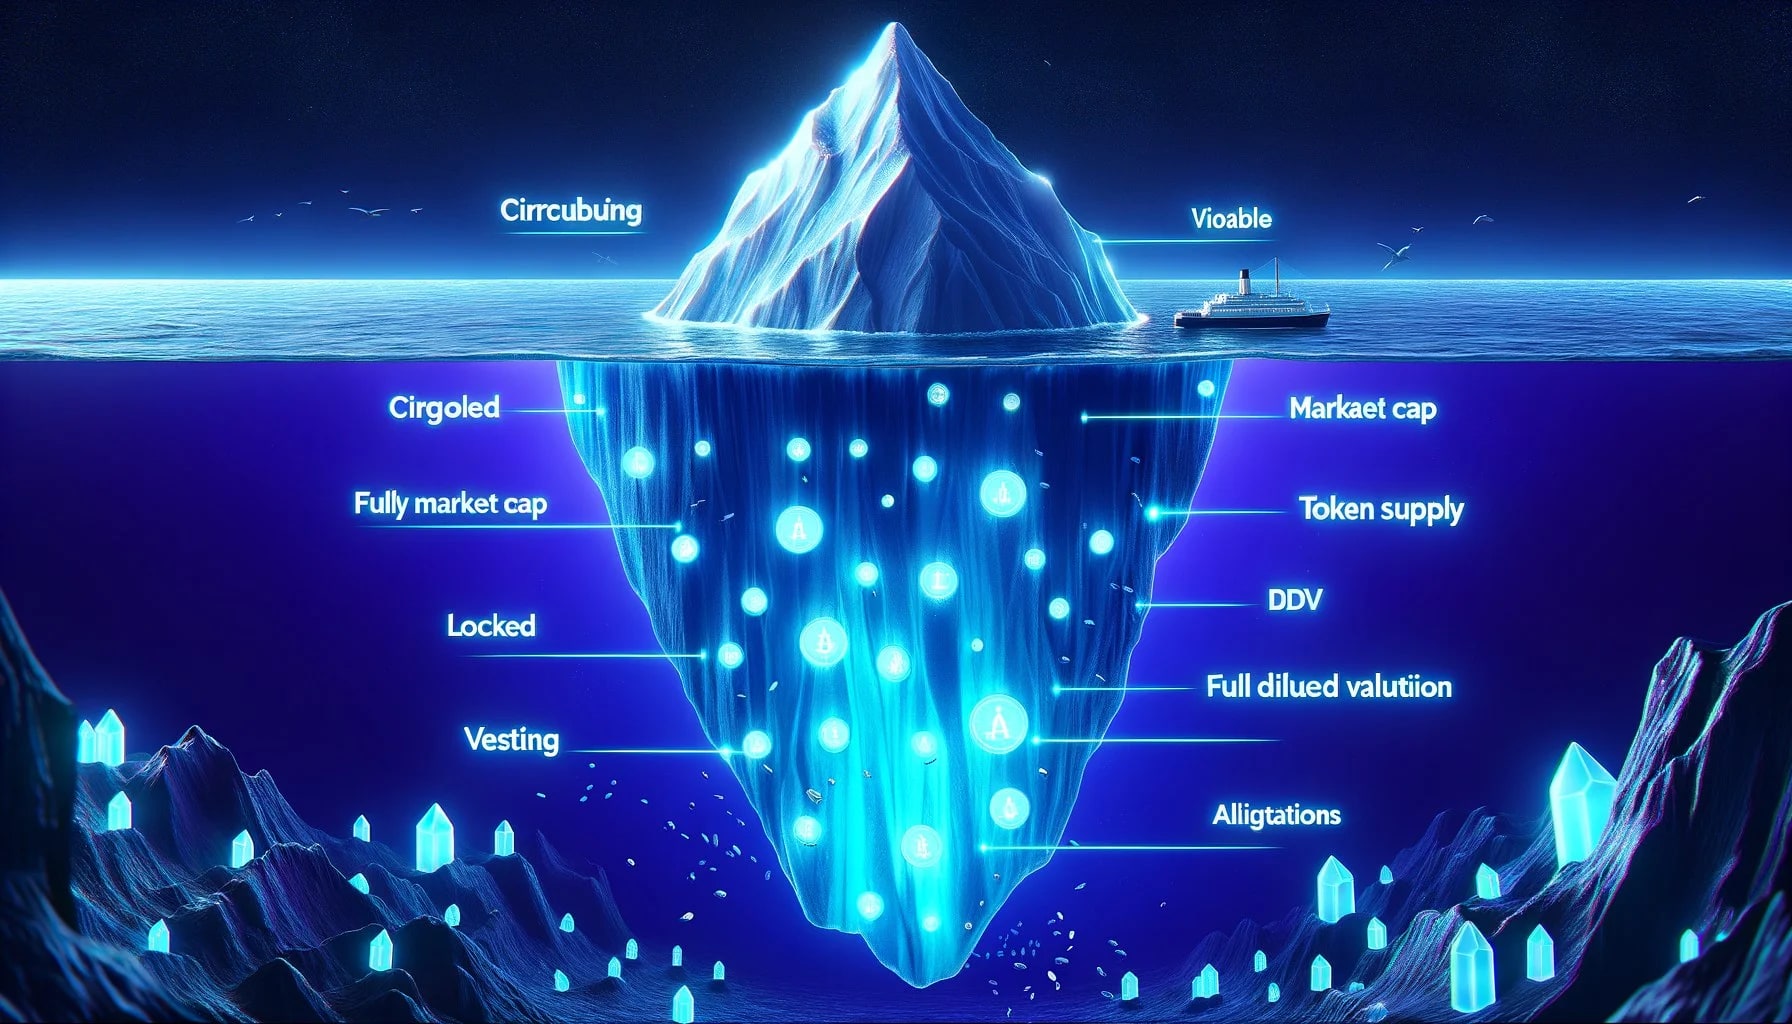
The Iceberg Analogy
The cleanest way to internalize the FDV concept is to think of every token as an iceberg. What you see floating above the water, the visible tip, is the market cap. It is the part of the project that the market has already priced and absorbed. What you do not see, the much larger mass submerged beneath the surface, is the gap between market cap and FDV. It is real, it is heavy, and it is going to surface over time according to the vesting schedule.
This is not just a cute metaphor. The Titanic did not sink because of the ice it hit. It sank because of the ice it could not see. The same principle applies to your portfolio. Buying a token at a $50 million market cap feels reasonable until you realize the FDV is $2 billion and 97% of the supply is sitting in a vesting contract counting down to your face.
Why FDV Matters: Future Sell Pressure
Every token that is unlocked from a vesting contract becomes a potential seller. Not a guaranteed seller, but a potential one. The team member whose tokens vest after one year may believe in the project, but they have rent to pay, taxes to file, and risk to diversify. The early investor who put in $500,000 at $0.01 and is sitting on a 50x at unlock will absolutely take some off the table. The treasury that needs to fund operations will quietly sell into liquidity. These flows are not malicious, they are not unusual, they are simply how every token economy works.
The dilution effect is brutal in math but obvious in practice. If a token has 100 million circulating and 1 billion max supply, then over time the supply expands tenfold. To keep the price flat, demand must grow tenfold just to absorb the new supply. If demand stays constant, the price falls 90%. That is not a worst case, that is the baseline arithmetic of dilution. The buyer of any low-float token is implicitly betting that demand growth will outpace supply growth, and that is a much harder bet than most people realize.
This is why understanding token vesting schedules is non-negotiable before any new token purchase. A high FDV is not automatically bad, but a high FDV combined with an aggressive unlock schedule and weak demand drivers is a recipe for a multi-year drawdown.
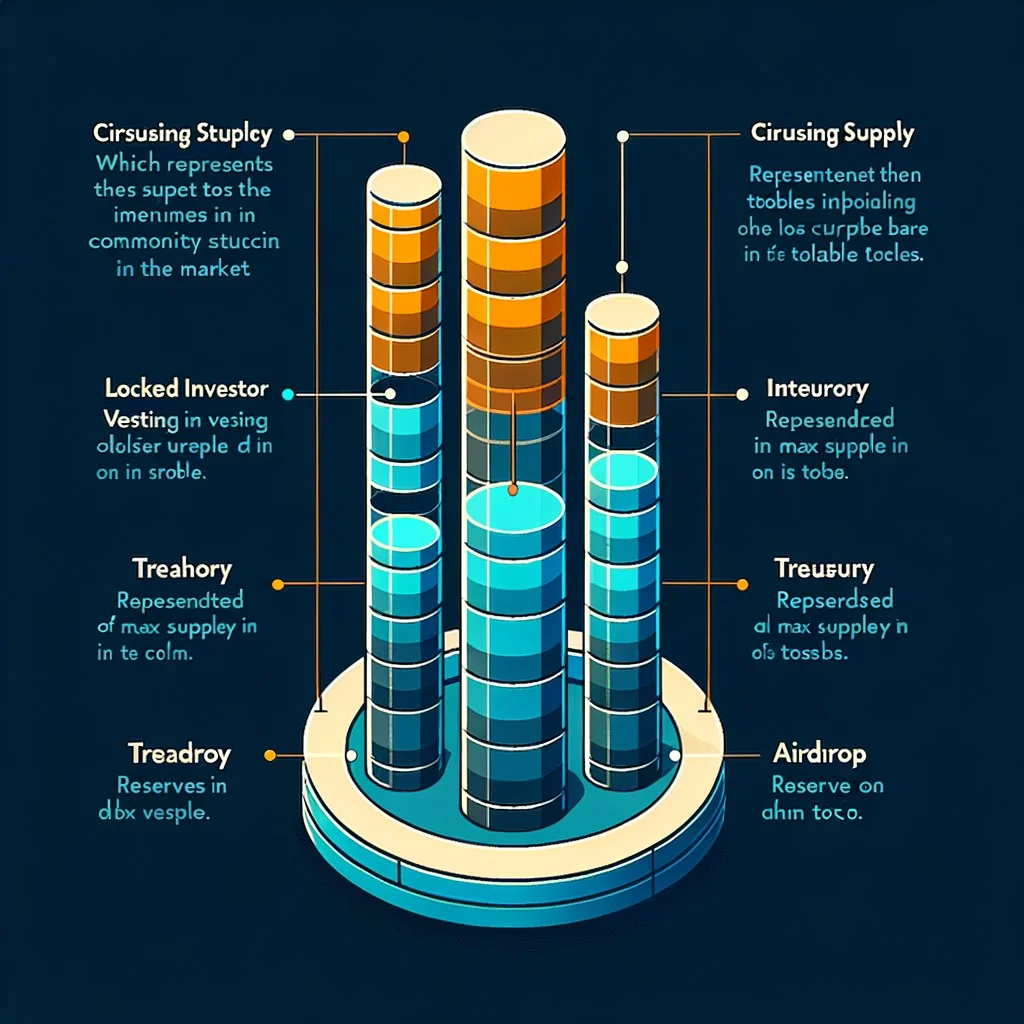
The Supply Allocation Bar
Almost every modern token allocates its supply across a handful of buckets, each with different lockup terms. The proportions vary, but the structure is remarkably consistent. Looking at a token's allocation bar tells you immediately how much hidden supply you are buying against.
This is the picture behind the FDV number. When you see that a token has FDV ten times its market cap, you are looking at exactly this kind of allocation chart. The team slice is typically locked for one year with a cliff, then linearly vested over two to four years. Investor slices follow similar patterns. Treasury and ecosystem allocations release on governance proposals or grant schedules. Future emissions, where they exist, follow a programmed inflation curve.
For a deeper look at how these unlocks affect price, read our piece on cliff vs linear vesting and what each does to short-term market structure.
Worked Examples: FDV in the Real 2026 Market
Abstract definitions only get you so far. The fastest way to develop intuition is to look at where major tokens actually sit on the FDV/MCap spectrum today.
Look at the spread. Bitcoin and Ethereum sit at roughly 1:1 because most of their supply already circulates and the remaining issuance is either tiny (BTC, where the last coin mines around 2140) or balanced by burns (ETH, where post-Merge issuance is offset by EIP-1559 fee burns in active periods). Solana sits in a healthy middle band where inflation is real but gradual. Then the picture changes dramatically.
Jupiter, Celestia, Starknet, and EigenLayer all sit in low-float territory. JUP at 2.7x is borderline acceptable for a project with genuine product-market fit and revenue. TIA at nearly 3x and STRK above 4x reflect the aggressive 2024 launch design where most insider supply was locked for 12 to 24 months. EIGEN at 5x is the textbook example of a high-FDV, low-float launch that pressured price for most of its first year of trading.
This is not a moral judgment. These are not bad projects. But buying at TGE means you accept the math of those ratios.
The Low-Float High-FDV Launch Problem
The 2024 to 2025 cycle will be remembered as the era of the low-float, high-FDV launch. The playbook was depressingly consistent across dozens of projects. Pre-launch valuations were set in private rounds at billions of dollars. Public price discovery happened with less than 10%, sometimes less than 5%, of supply circulating. Centralized exchanges listed the token immediately, pumped on thin float, then began a relentless 12 to 36 month grind down as cliffs unlocked.
The math is the same as a regular dilution but compressed and disguised. A project launches at $10 with 50 million tokens circulating out of 1 billion max. Market cap is $500 million, which sounds reasonable. FDV is $10 billion, which would put it in the top 30 cryptocurrencies if true. The market sees the $500 million number, retail piles in. Six months later the cliff hits and 100 million new tokens unlock. Even with the same demand, the price has to halve just to keep market cap flat. In practice, demand also softens, and the price falls 70 to 90% from launch.
This pattern was so consistent in 2024-2025 that smart traders developed a simple heuristic: avoid any TGE where circulating supply is below 15% of max supply, regardless of how strong the project narrative is. The dilution overhang is too large and the price discovery is too distorted by the thin float. For context on how this differs from older fundraising models, see our piece on ICO history, where projects often launched with much higher initial floats.
FDV/MCap Ratio: Reading the Thermometer
Once you internalize the FDV concept, the single most useful derived metric is the FDV/MCap ratio. Think of it as a sell-pressure thermometer. The higher the ratio, the more future supply is pending and the more aggressively you need to discount the current price for future dilution.
The thermometer is not a verdict, it is a question. A ratio of 5 does not mean the project will fail. It means you should ask: is the team competent enough, is the product strong enough, and is the demand growth fast enough to absorb a fivefold supply expansion at this price? Sometimes yes. Usually no. The ratio just tells you what burden the project has to clear.
Pair this ratio with the actual unlock calendar. A 3x ratio with unlocks spread across five years is much less dangerous than a 3x ratio with everything cliff-unlocking in the next twelve months. Tools like Token Unlocks, CryptoRank, and DEXTools each provide unlock visualizations that you should consult before buying anything with a high FDV multiple.
How to Find FDV on CoinGecko, CoinMarketCap, and DEXTools
Knowing the concept is useless if you cannot find the number. Fortunately every major data platform surfaces FDV prominently, and they all source it from on-chain max supply combined with current spot price.
On CoinGecko, open any token page. In the right-hand stats column, you will see "Market Cap", "Fully Diluted Valuation", "Volume 24h", and supply rows. The FDV figure is listed in plain dollars. CoinGecko also computes the FDV/MCap ratio for you on most token pages, hidden in the supply details tab. If FDV shows a dash or "infinity", it means the token has no defined max supply, which we will discuss in the next section.
On CoinMarketCap, the layout is similar. The token detail page shows Market Cap, FDV, and Volume side by side in the top stats band. Hover over the question mark next to FDV and CMC explains its formula in a tooltip. CoinMarketCap is generally a touch slower to update max supply changes than CoinGecko, so for newly issued tokens cross-check both.
On DEXTools, where most early-stage and on-chain tokens live, FDV appears in the token info panel above the chart. For tokens that have just launched on a DEX, DEXTools pulls max supply directly from the smart contract, which is usually more reliable than aggregator data because it does not depend on a manual listing process. You can also see the contract address, holder distribution, and liquidity, all of which feed into how you interpret the FDV figure.
For deeper distinctions between a coin's native blockchain accounting versus an ERC-20 token's contract-level cap, see coin vs token. The way max supply is enforced is structurally different in each case.
When FDV Is Misleading
FDV is not a universal truth. There are several common situations where the number on the dashboard is misleading and you need to overrule it with judgment.
Perpetual emission tokens. Some protocols have no max supply by design. Ethereum is the headline example: it has no hard cap, and post-Merge issuance can be net positive or negative depending on gas activity and burn rate. Dogecoin is another: it mints 10,000 new DOGE every block forever, so its max supply is effectively infinite. CoinGecko and CMC handle this by showing FDV as equal to MCap, but that is a convenience, not a truth. For DOGE in particular, expect roughly 5 billion new tokens per year of dilution that the FDV figure does not capture.
Burn-heavy tokens. Conversely, tokens with aggressive burn mechanics can have an effective max supply much lower than the contract states. BNB has been burning quarterly for years and its functional max supply trends downward over time, which makes the static FDV figure slightly pessimistic. Always check if a token has a documented burn schedule before taking FDV at face value.
Tokens that never actually unlock fully. Some treasury or DAO allocations are technically in the supply but politically very unlikely to ever be sold. A DAO sitting on 30% of the supply for ecosystem grants may release tokens at a rate of 1% per year for the next thirty years, which is functionally equivalent to those tokens not existing for trading purposes. The headline FDV treats them the same as cliff-unlocked investor tokens, which is wrong.
Missing or stale max supply data. For very new tokens, the max supply field on aggregators is sometimes blank or wrong, especially if the team has not formally communicated tokenomics. In those cases the displayed FDV is unreliable. Always cross-check the contract directly on a block explorer when the numbers feel off.
Tail emission with utility sink. Some tokens have inflation but also strong sinks (staking, burns, fee buybacks) that absorb the supply expansion. SOL is the classic example: inflation exists but a meaningful fraction of issuance is staked and locked, plus fee burns. The static FDV does not credit those sinks.
FDV in Tokenomics Evaluation
FDV is one input in a larger tokenomics analysis, not the only number you should look at. When you sit down to evaluate a new token, FDV should be combined with three other pieces of information to form a complete picture.
First, the unlock schedule. A token's vesting calendar matters as much as its FDV. Two tokens with identical FDV but different unlock cadences will trade very differently. Cliff unlocks create concentrated sell pressure; linear unlocks create constant drip pressure. Both eat returns, but in different ways.
Second, the demand drivers. What forces buyers to acquire and hold this token? Governance? Staking yield? Burn-from-fees? Utility within the protocol? If demand sinks are weak relative to supply emissions, FDV will become realized as the price compresses. If demand sinks are strong, the project can grow into its FDV.
Third, the team's track record on emissions. Some teams over-issue, dilute aggressively, and prioritize insider liquidity. Others under-issue, use treasury proceeds carefully, and align incentives long-term. The same FDV number means very different things in those two cases.
If you are serious about due diligence, also check whether team tokens are sitting in a token locker contract with publicly verifiable expiry, or in a multisig where the team could in theory accelerate vesting. The first is a much stronger commitment than the second.

Beware "Reasonable FDV" Marketing
One of the most subtle traps in the launch market is the way teams talk about FDV in pitch decks and investor calls. Phrases like "our FDV is conservative compared to comparable projects" or "we are launching at a reasonable FDV multiple" are designed to defuse exactly the concern this article is teaching you to have.
The trick works by framing FDV as a feature rather than a cost. The pitch goes: "Look, our FDV is only $800 million, which is much cheaper than competitor X at $3 billion FDV. You are getting in early at a discount." What that framing conveniently omits is that FDV is not a discount, it is a ceiling. A token does not arrive at its FDV. It has to climb to it through demand growth, while supply is constantly expanding underneath it. Buying at $800 million FDV does not get you a discount versus a $3 billion project. It gets you a different supply curve and a different competitive position.
The honest framing of FDV in a pitch deck would sound more like: "We are launching with a $50 million market cap and an $800 million FDV, which means 94% of supply will unlock into the market over the next 36 months. Here is our plan for generating enough demand to absorb that supply." That kind of honesty is rare, but when you see it, take it seriously. It usually correlates with a healthier project.
Memecoins and FDV: A Different Game
Almost everything in this guide so far applies to project tokens with vesting schedules, team allocations, and investor rounds. Memecoins are a different category and need to be analyzed differently.
Most modern memecoins, especially those launching on platforms like Pump.fun, Sun.pump, Believe, or directly on a DEX, mint 100% of supply at TGE with no vesting and no team allocation reserved off-market. For these tokens, circulating supply equals max supply equals total supply, so MCap equals FDV by definition. The FDV/MCap ratio is always 1.0.
That makes the FDV analysis trivial, but it does not make memecoins safe. The risks shift to other variables: liquidity pool size, holder concentration, dev wallet behavior, and whether the launch contract is verified and renounced. For these tokens, holder distribution and rug indicators matter far more than FDV. The absence of dilution risk does not equal the absence of risk; it just moves the risk to a different part of the system.
Pay particular attention to the supply concentration on memecoins. Even with FDV equal to MCap, if one wallet holds 30% of supply, the effective tradable float is much lower than it appears, and the sell-pressure thermometer needs to be interpreted differently. A 100% circulating memecoin with a whale holding a third of supply is functionally a low-float token, just with a different distribution mechanism.
Building a Personal FDV Watchlist
Once you understand FDV, the natural next step is to operationalize the knowledge with alerts. The goal is to know in advance when major token unlock events are about to hit the tokens you hold or watch.
Token Unlocks (token.unlocks.app) is the most widely used calendar for upcoming unlock cliffs. It lists hundreds of major tokens with dates, sizes, and percentage-of-supply impact. You can set email or Telegram alerts on specific tokens to get warned when a large unlock is approaching. The free tier covers most of what a retail trader needs.
CryptoRank has a similar unlocks dashboard, with the addition of historical unlock event data so you can study how previous unlocks affected price for a given project. This is genuinely useful: knowing that a project's last three cliff unlocks each preceded a 15-25% drawdown gives you a much sharper expectation for the next one.
DEXTools integrates basic unlock visibility into its token panels and can be combined with its alert system to notify you when a specific contract balance changes meaningfully, which often correlates with unlocks transferring out of vesting wallets.
The discipline of checking the unlock calendar before any position sizing decision is one of the highest-leverage habits a serious crypto buyer can build. It takes thirty seconds, it is free, and it directly reduces your exposure to predictable sell pressure.
Frequently Asked Questions
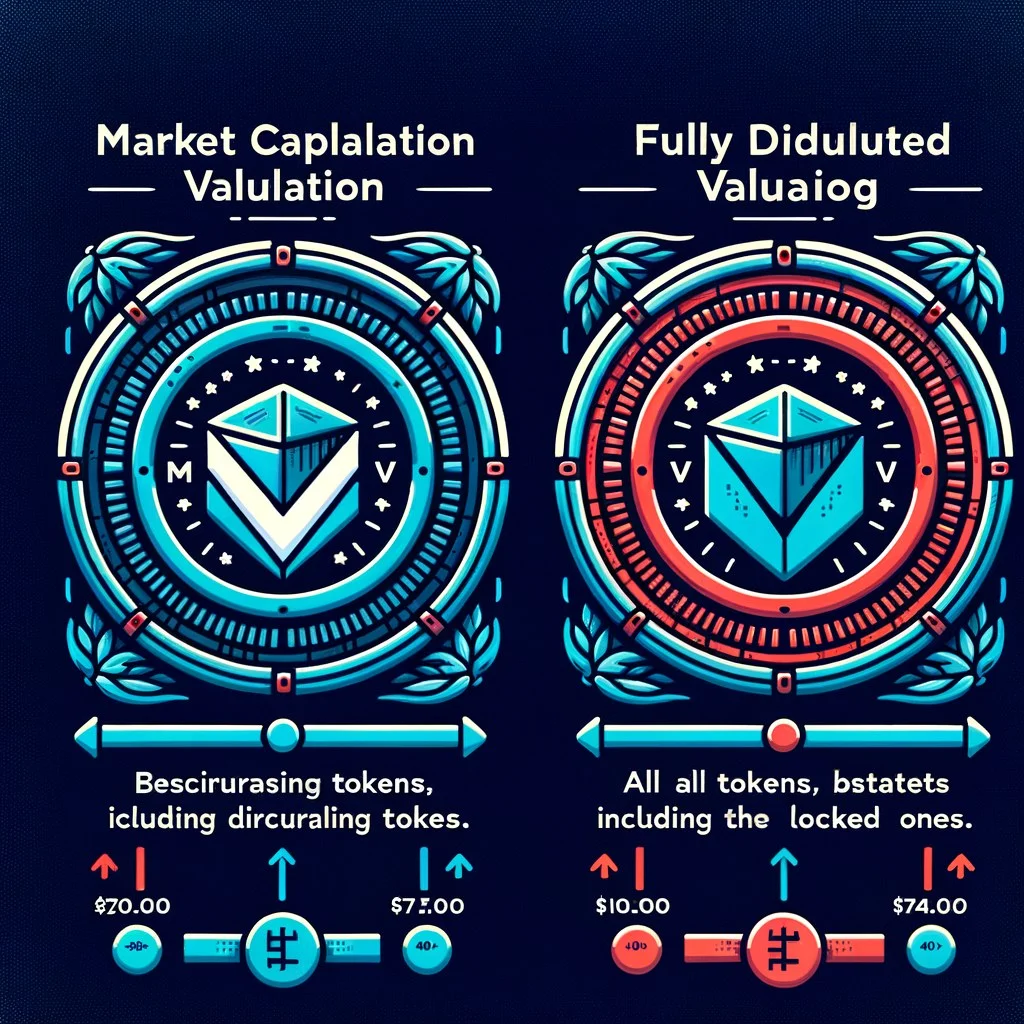
What is the difference between FDV and market cap?
Market cap multiplies current price by circulating supply, which is the number of tokens actually trading in the market today. FDV multiplies current price by max supply, which includes every token that will ever exist according to the protocol's rules. The gap between the two is your future inflation. If MCap and FDV are nearly equal, almost all the supply is already in the market. If FDV is many times higher than MCap, large tranches of tokens are still locked and waiting to unlock.
Is a high FDV always bad?
No. A high FDV simply means a lot of supply is still pending unlock. Whether that is bad depends on the unlock schedule, the strength of demand for the token, and the team's discipline on emissions. A project with strong product-market fit and revenue can grow into a high FDV. A project without those qualities will see its price compress as supply expands. High FDV is a warning to look closer, not an automatic disqualifier.
How is FDV calculated?
FDV equals max supply multiplied by the current market price of the token. If a token has a max supply of 1 billion and trades at $2, its FDV is $2 billion regardless of how many tokens are circulating today. For tokens with no max supply, like Ethereum or Dogecoin, FDV is either undefined or set equal to market cap as a convention, but in both cases the figure understates true future dilution.
What is a good FDV/MCap ratio?
Ratios between 1.0 and 1.5 are healthy and mean most supply is already in the market. 1.5 to 3.0 is acceptable for active projects with strong demand drivers but requires you to check the unlock schedule. 3.0 to 5.0 is risky because dilution is substantial and the price must climb against constant supply expansion. Above 5.0 is the danger zone, typical of low-float launches, where price action is dominated by unlock dynamics for years.
Why does FDV matter for new launches?
New launches typically circulate only a small fraction of total supply, sometimes under 5%. That means the FDV reflects almost the entire future dilution overhang baked into the current price. If you buy at TGE without checking FDV, you are buying the thin tip of the iceberg at a price that implies the rest of the iceberg also has buyers willing to pay the same level. Historically, that assumption has failed for most low-float launches, leading to multi-year drawdowns even for projects with solid fundamentals.
Where do I find FDV data?
CoinGecko, CoinMarketCap, and DEXTools all display FDV prominently on every token detail page. CoinGecko and CMC show it in the stats column next to market cap. DEXTools shows it in the token info panel above the chart, sourced directly from the smart contract. For upcoming unlocks that affect realized FDV, use Token Unlocks (token.unlocks.app) or CryptoRank's unlock calendar.
Does FDV apply to memecoins?
Technically yes, but in practice memecoins usually launch with 100% of supply in circulation and no vesting, so FDV equals market cap. The FDV/MCap ratio is therefore always 1.0 and provides no additional information. For memecoins, the metrics that matter are holder concentration, liquidity pool size, and whether the contract is verified and ownership renounced. Risk shifts away from dilution and onto distribution and contract-level concerns.
Conclusion
Fully diluted valuation is the single most useful metric for cutting through the noise of crypto launches in 2026. It tells you, in one number, how much of a project's future supply has already been priced and how much is still pending. Combined with the unlock schedule and the FDV/MCap ratio, it gives you a sell-pressure forecast that most retail buyers never bother to compute, which is precisely why understanding it puts you ahead.
The mistakes to avoid are simple but recurrent. Do not buy a token based on a low market cap when the FDV is twenty times higher and most supply is still locked. Do not trust pitch deck framing that treats FDV as a discount rather than a ceiling. Do not extrapolate memecoin-style 100% float dynamics to project tokens with multi-year vesting curves. And do not ignore the unlock calendar, ever.
Build the habit. Every time you look at a new token, before you check the price chart, before you check social sentiment, before you read the whitepaper, look at three numbers: circulating supply, max supply, and FDV. If the ratio is healthy, proceed with normal due diligence. If the ratio is hot or boiling, pull up the unlock calendar before doing anything else. That single discipline will save you more money over the next cycle than any chart pattern, any indicator, and any influencer call.
Related Guides
- FDV vs Market Cap in Crypto: How to Read Unlock Risk Before You Buy (2026)
- Market Cap vs FDV in Crypto: What the Gap Really Means (2026)
- The Market Cap Mirage: Why Token Valuation Means Little Without Depth
- Stock-to-Flow Bitcoin Model: Scarcity Valuation Guide (2026)
- Meme Coin Market Cap: How to Read Market Cap, FDV & Supply