How to Use DeFi Llama: Complete TVL and DeFi Research Tutorial (2026)
— By Tony Rabbit in Tutorials

Complete DeFi Llama tutorial for 2026. Learn to track TVL, compare chains, research protocols, find yield opportunities, monitor DEX volumes, and build investment research workflows.
DeFi Llama is a free, open-source DeFi analytics dashboard that aggregates Total Value Locked (TVL) and financial data across over 200 blockchains and 3,000 protocols. It provides unbiased data for researchers, investors, and traders to understand capital flows in decentralized finance, offering features like yield comparison, DEX volume analysis, and stablecoin monitoring.
DeFi Llama is the most trusted source for DeFi analytics in crypto. Tracking Total Value Locked (TVL) across every major blockchain and protocol, DeFi Llama gives researchers, investors, and traders the data they need to understand where capital flows in decentralized finance. It's completely free, open-source, and has no ads or token - making it one of the most unbiased data sources in the industry.
This tutorial covers how to use every major DeFi Llama feature - from TVL tracking and yield comparison to DEX volume analysis, stablecoin monitoring, and protocol research.
What Is DeFi Llama?
DeFi Llama is an open-source DeFi analytics dashboard that aggregates TVL (Total Value Locked) and financial data across all major blockchains and DeFi protocols. Unlike CoinGecko or CoinMarketCap which focus on token prices, DeFi Llama focuses on where actual capital is deployed in DeFi - lending pools, DEX liquidity, staking contracts, bridges, and more.
Think of TVL as the DeFi equivalent of "assets under management" in traditional finance. When TVL increases for a protocol or chain, it signals growing confidence and usage.
Step 1 - Understanding the TVL Dashboard
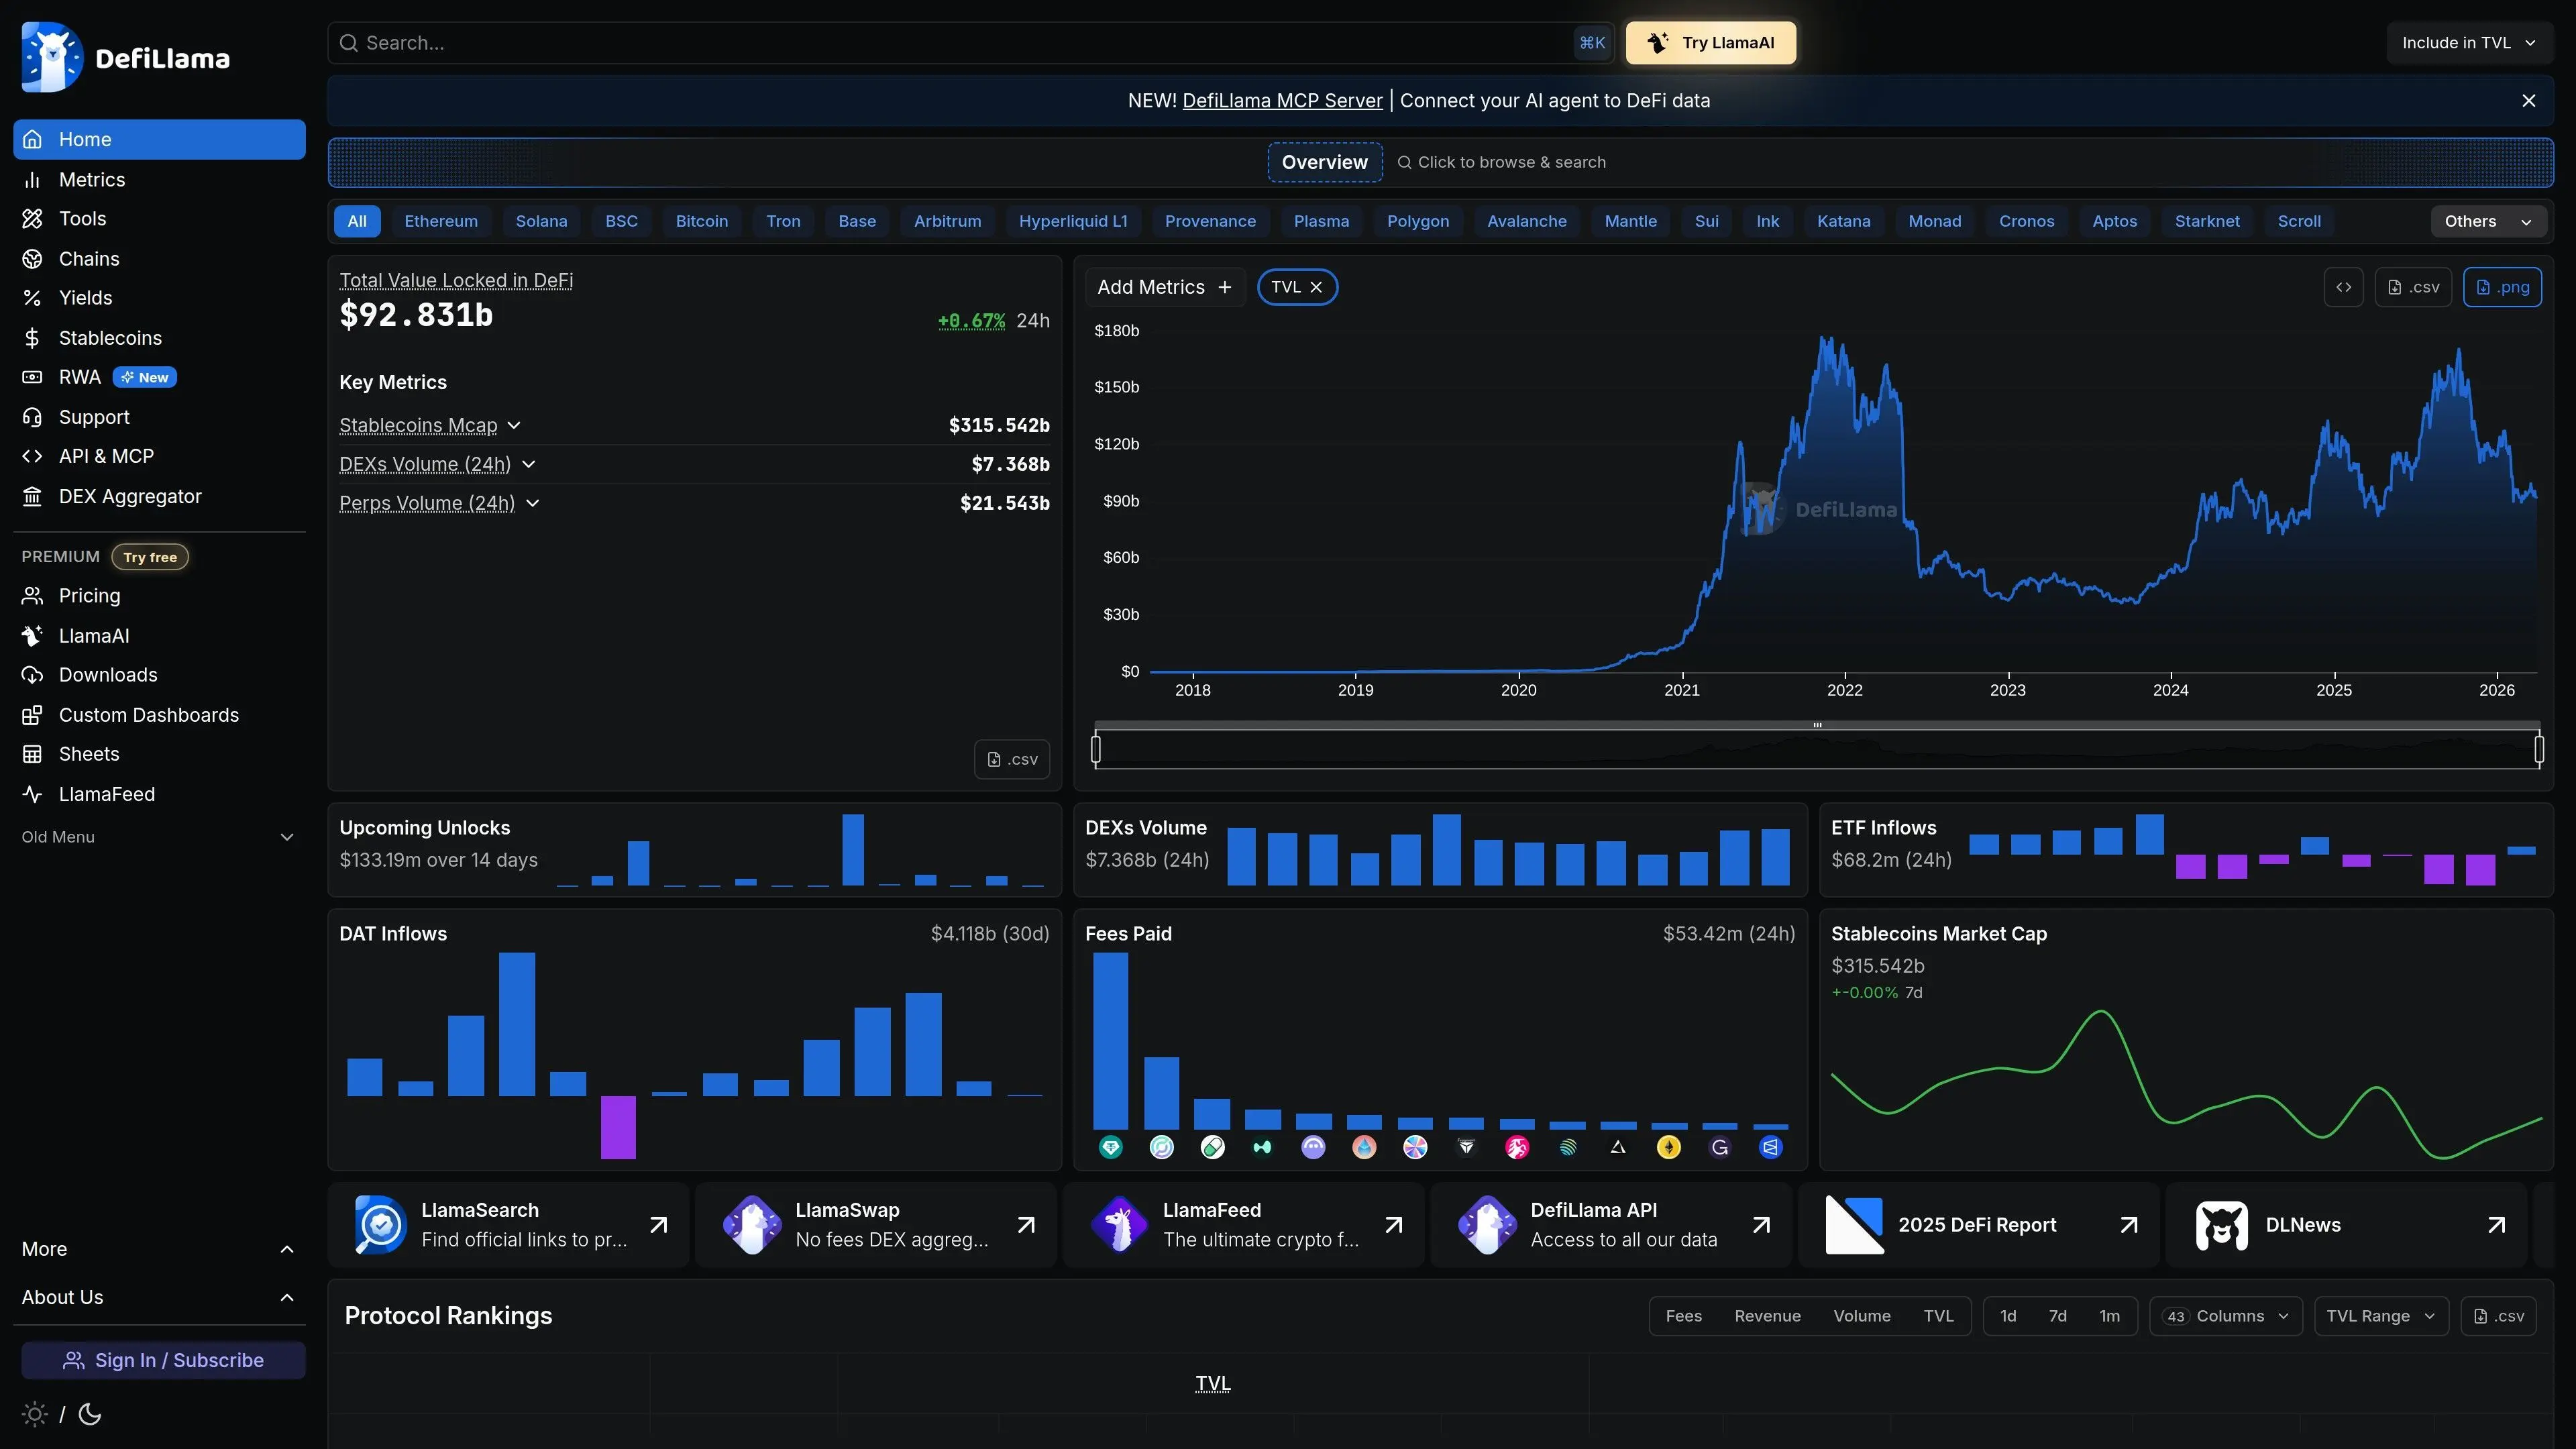
The DeFi Llama homepage at defillama.com shows the total DeFi TVL across all chains, with a historical chart and the top protocols ranked by TVL.
Key metrics on the homepage:
- Total DeFi TVL - All capital locked across all chains and protocols
- 24h Change - Whether capital is flowing in or out of DeFi
- Protocol Rankings - Top protocols by TVL (Lido, Aave, MakerDAO, etc.)
- Chain Distribution - How TVL is split across Ethereum, Solana, BSC, etc.
Step 2 - Chain Comparison
The Chains page shows TVL breakdown by blockchain - essential for understanding which ecosystems are growing.

You can compare chains by:
- TVL - Raw capital locked
- TVL Change - 1d, 7d, 30d percentage changes
- Protocols - Number of DeFi protocols on each chain
- Stablecoins - How much stablecoin liquidity each chain has
This data is invaluable for identifying emerging chains. If a chain's TVL is growing rapidly while others stagnate, it often signals where the next wave of DeFi activity will concentrate. For Solana-specific ecosystem trends, see our Solana ATH analysis.
Step 3 - Protocol Research
Click any protocol to see its detailed analytics page:
- TVL chart with historical data (days, weeks, months, years)
- Chain breakdown - TVL distribution across chains (for multi-chain protocols)
- Token info - Market cap, FDV, MCap/TVL ratio
- Revenue and fees - How much the protocol earns
- Treasury - Protocol treasury holdings
- Governance - Links to governance forums and proposals
Step 4 - Yields and Opportunities
DeFi Llama's Yields page aggregates yield opportunities across all DeFi protocols - one of the most powerful features for investors seeking passive returns.
Filter yields by:
- Chain - Solana, Ethereum, Arbitrum, etc.
- Project - Specific protocols like Aave, Marinade, Jito
- Token - Find the best yield for specific assets (SOL, ETH, USDC)
- TVL minimum - Filter out tiny pools with unsustainable yields
- APY range - Target specific yield ranges
This is perfect for finding the best staking and lending opportunities. For example, find the highest-yielding SOL staking option or the best USDC lending rate across all platforms.
Step 5 - DEX Volume Tracking
The DEXs page shows trading volume across all decentralized exchanges - critical for understanding market activity and which DEXes are winning.
Track daily, weekly, and monthly DEX volumes to identify trends. Rising DEX volume often precedes market moves. You can also compare DEXes by chain - for example, see whether Jupiter or Raydium is handling more volume on Solana.
For hands-on DEX trading tutorials, see our guides on Uniswap, Jupiter, and Raydium.
Step 6 - Additional DeFi Llama Tools
Stablecoins Dashboard
Track stablecoin market cap and flow across chains. This reveals capital movement - stablecoins flowing into a chain often precede DeFi growth and price action on that chain's native token. Learn more in our best stablecoins comparison.
Bridges
Monitor cross-chain bridge volumes. See which bridges are moving the most capital and which chains are receiving inflows.
Fees and Revenue
Compare protocol revenue to understand which DeFi applications generate real income. Protocols with high fees relative to TVL are typically more sustainable.
Raises
Track venture capital funding in crypto. See which projects raised money, from whom, and at what valuation - useful for identifying projects with strong backing.
Liquidations
Monitor at-risk positions across lending protocols. During market downturns, this page shows potential cascade liquidation levels.
Using DeFi Llama for Investment Research
Here's a practical research workflow using DeFi Llama:
- Macro view - Check total DeFi TVL trend. Growing = bullish signal for DeFi tokens
- Chain analysis - Identify chains with fastest TVL growth
- Protocol comparison - Within growing chains, find protocols gaining TVL share
- Valuation check - Compare MCap/TVL ratios among similar protocols
- Revenue validation - Verify the protocol generates real fees (not just emissions)
- Yield opportunity - Use the yields page to find the best returns for your assets
Frequently Asked Questions
Related Guides
- Utilization Rate vs TVL: The DeFi Metric That Matters
- 5 Best Crypto Lending Platforms 2026: APY, TVL & Safety
- Protocol Revenue vs TVL: Understanding DeFi Demand
- Liquidity Turnover vs TVL: How to Know If a DeFi Pool Is Active or Idle
- How to Use DefiLlama: Track TVL, Stablecoins and Protocol Revenue (2026)