How to Use DefiLlama: Track TVL, Stablecoins and Protocol Revenue (2026)
— By Tony Rabbit in Tutorials

Learn how to use DefiLlama for DeFi research in 2026 - from TVL and stablecoin flows to protocol fees, revenue, and stronger DEXTools-backed market analysis.
Intent check: This page is the hands-on DefiLlama workflow. If you want the definition-first platform explainer, read What Is DefiLlama?.
DefiLlama is one of the most useful crypto research platforms in 2026 if you care about what is happening under the surface of the market, not just which coin is green today. It tracks total value locked, stablecoin movements, protocol fees, revenue, yields, bridges, and ecosystem growth across DeFi. That gives you a much clearer read on where capital is flowing, which sectors are heating up, and whether a protocol is actually gaining traction or just riding temporary hype.
This guide shows you how to use DefiLlama properly, from reading chain and protocol dashboards to tracking stablecoin inflows and comparing revenue quality. If you already use DEXTools for charts and execution, DefiLlama is the perfect complement because it helps you build stronger conviction before you ever enter a trade.
What You Will Learn
- How to use DefiLlama to identify real DeFi growth instead of noisy narratives
- How to read TVL by chain, protocol, and category without getting fooled
- How to use stablecoin dashboards to detect liquidity migration early
- How to compare fees, revenue, and yields when evaluating protocols
- How to combine DefiLlama with DEXTools and other research tools for a stronger workflow
What Is DefiLlama and Why It Matters
DefiLlama is often described as a DeFi TVL tracker, but that undersells what the platform has become. Today it is one of the best free intelligence layers in crypto. Instead of focusing on token prices, it focuses on actual ecosystem activity. That means you can see where liquidity is going, which chains are gaining stablecoin supply, which protocols are producing fees, and how narratives evolve over time.
That matters because price alone is often a late signal. By the time everyone is tweeting about a new trend, much of the easy move may already be gone. DefiLlama gives you a chance to see structural changes earlier. When stablecoins start flowing into a chain, when protocol fees accelerate, or when TVL rises together across related applications, that can tell you more than a single chart candle ever will.
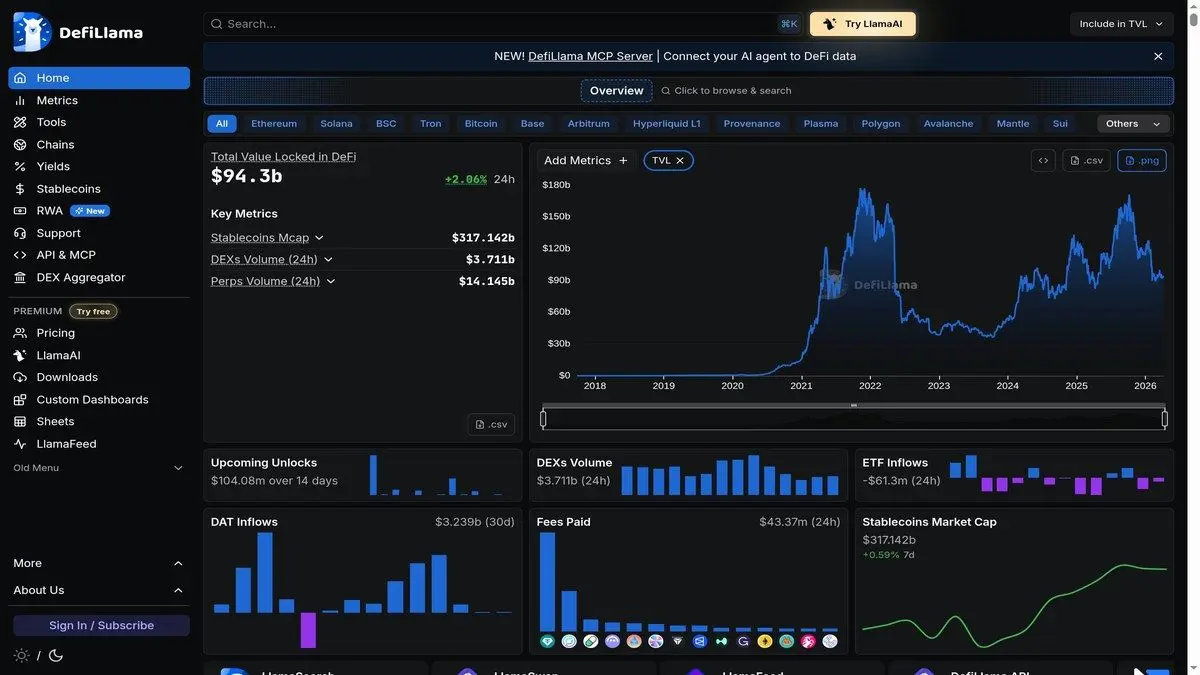
Start With the Homepage, But Learn What the Rankings Really Mean
When you first open DefiLlama, the homepage gives you a quick market-level overview. You can scan top chains, leading protocols, and headline DeFi metrics within seconds. For a fast pulse check, that is excellent. But if you stop there, you risk reading the market too simplistically.
TVL is useful, but context matters. A jump in TVL can come from real user growth, token price appreciation, incentive programs, whales, or capital cycling between protocols. That is why strong DefiLlama research is less about memorizing rankings and more about learning to ask better follow-up questions.
- Is TVL rising because a chain is getting real user growth, or because token prices went up?
- Is one protocol dominating the increase, or is an entire category expanding?
- Are fees and revenue rising alongside TVL, or is liquidity sitting idle?
- Are stablecoins entering the chain at the same time, suggesting stronger participation?
How to Use Chain Dashboards to Spot Ecosystem Strength
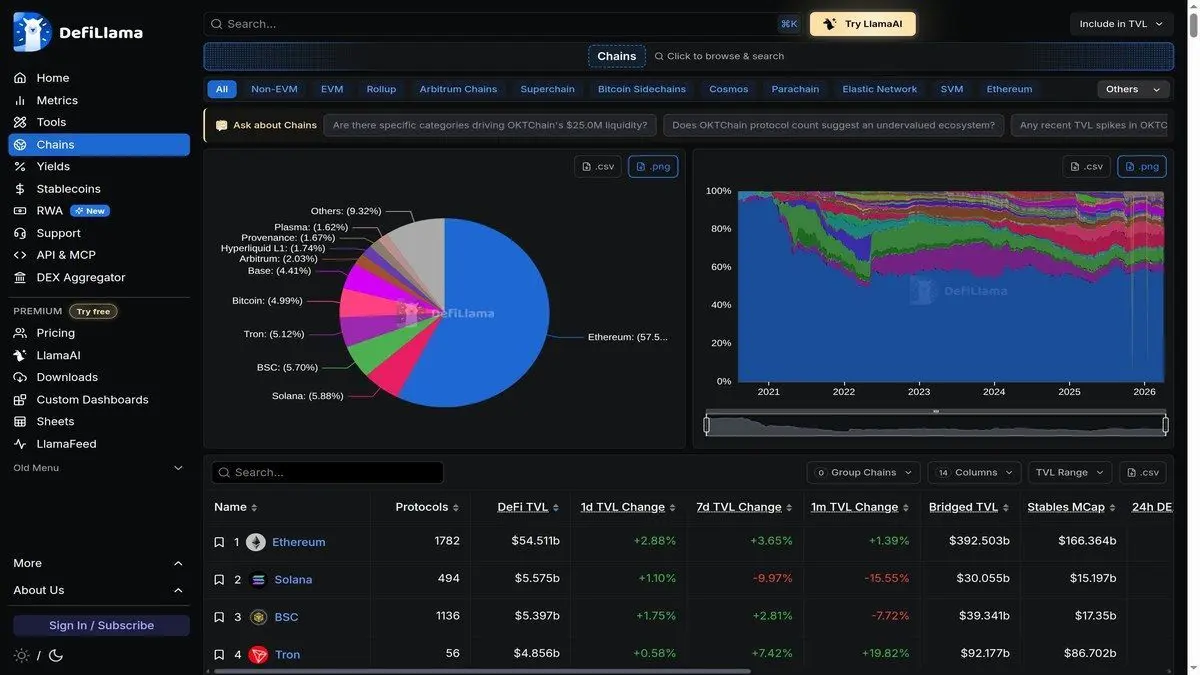
The chain pages are one of the strongest parts of DefiLlama. They let you compare ecosystems by total value locked, stablecoin balances, bridge activity, and the individual protocols that make up each chain. This is where you stop thinking in terms of isolated tokens and start thinking in terms of entire market rotations.
For example, imagine that one ecosystem starts climbing in TVL while stablecoins rise and multiple DEX and lending protocols begin gaining share. That tells a very different story than a single token pumping on social momentum. You are seeing coordinated activity, not just noise. That kind of structure is often where better opportunities begin.
The most useful comparison is to overlay two or three chains against each other over a 30-day or 90-day window. You want to identify which direction is most consistent and whether the growth is happening across many apps or concentrated in one protocol.
Best Questions to Ask on a Chain Page
- Is TVL growth broad across the ecosystem or concentrated in one protocol?
- Are there stablecoin inflows supporting the move?
- Which categories are leading - DEXs, lending, liquid staking, bridges, or perps?
- Does this trend line up with what you see on DEXTools charts?
- Is bridge activity rising, suggesting external capital entering?
Stablecoin Data Is One of the Biggest Edges on DefiLlama
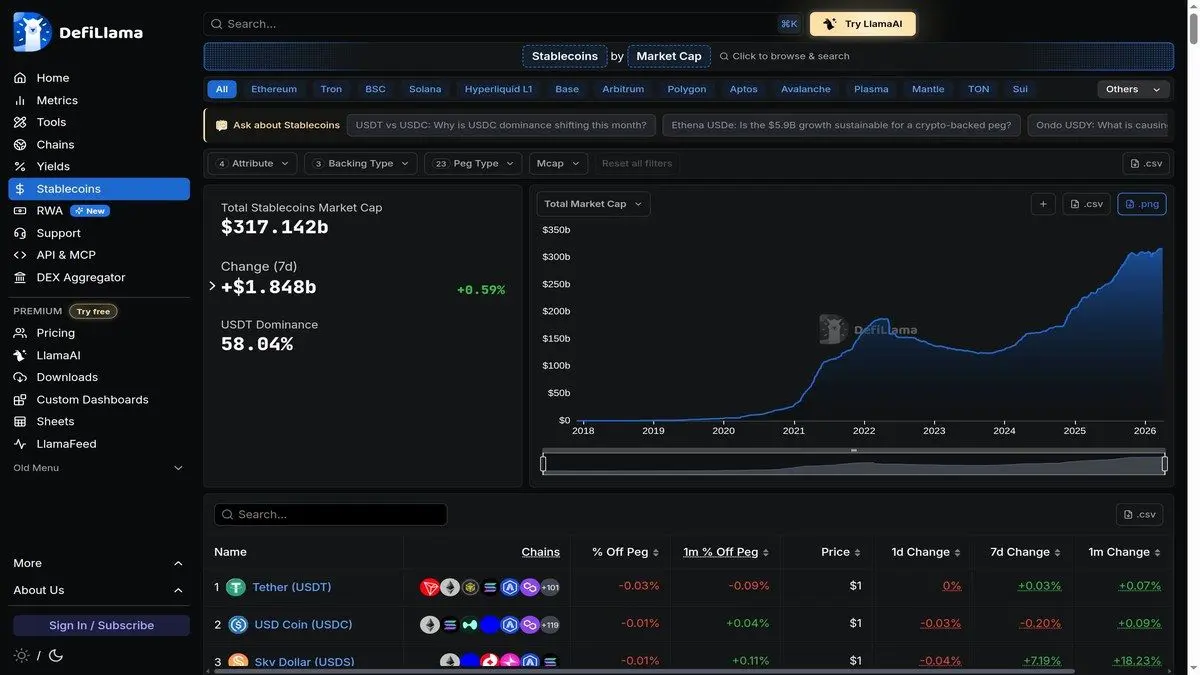
If you only use one advanced DefiLlama feature consistently, make it the stablecoins dashboard. Stablecoin movements often reveal changing market conditions before mainstream narratives catch up. When USDT, USDC, or chain-native dollar liquidity begins building inside a network, it can be an early signal of improving opportunity.
That does not guarantee that every token on the chain will outperform. But it does tell you that capital is arriving, and that matters. A chain with growing stablecoin balances often has better conditions for trading, more active deployment, and stronger interest from both users and speculators.
What makes stablecoin data particularly powerful is that it is harder to fake. Token prices can spike on low volume. TVL can inflate through circular lending. But stablecoins flowing into a chain usually represent real capital that is ready to be deployed. That is a fundamentally stronger signal.
A practical workflow is simple. Use stablecoin inflows to identify chains worth monitoring. Then open the strongest ecosystem tokens and pairs inside DEXTools, and compare them with research tools like CoinMarketCap or CoinGecko for broader market context.
Use Fees and Revenue to Separate Real Usage From Empty TVL
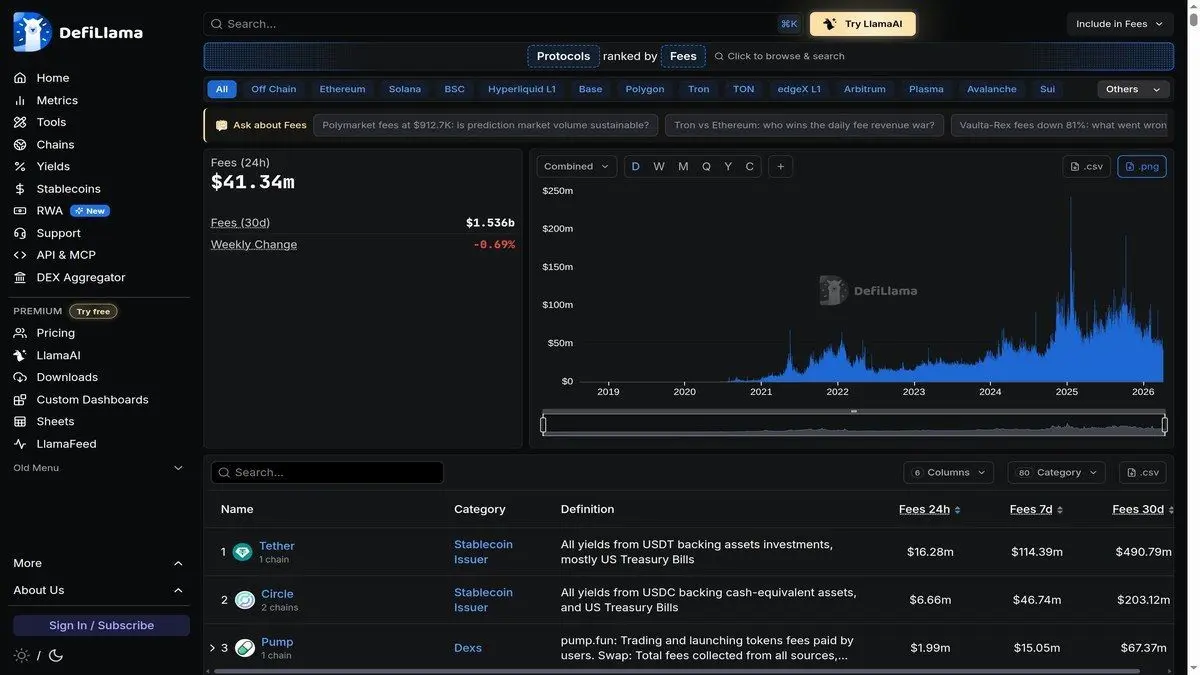
One of the most powerful shifts in crypto research comes when you stop asking only where liquidity sits and start asking where value is actually being generated. DefiLlama helps here with dashboards for fees and revenue, which are much better measures of protocol quality than raw TVL alone.
A protocol with large deposits but weak fees may be over-incentivized, underused, or structurally unimpressive. By contrast, a protocol producing strong fees with healthy growth can signal product-market fit inside crypto terms. That does not automatically make it a great token trade, but it makes it much more worthy of deeper analysis.
Revenue is even more telling than fees in many cases. Fees measure what users paid. Revenue measures what the protocol kept. That distinction helps you understand which applications have viable business models and which are likely to face margin compression once incentive programs run out.
Healthy Signals
- Fees rising with user activity
- Revenue improving over multiple windows
- Broad ecosystem participation
- Support from stablecoin or bridge flows
- Multiple metrics trending in the same direction
Warning Signs
- TVL spikes with weak fees
- Yield chasing without durable stickiness
- One protocol carrying the whole chain story
- Social hype not confirmed by on-chain behavior
- Stablecoins flat or leaving despite price action
Yields and Airdrops as Research Signals
DefiLlama also tracks yields and airdrop opportunities across protocols and chains. While these sections are often used by yield farmers, they also contain valuable research signals for directional traders. When yields on a particular chain spike, it often means new capital is being attracted. When airdrop expectations increase around a protocol, usage and TVL can follow. That kind of anticipation-driven activity can create tradable setups if you spot them early.
The key is not to chase yield blindly but to use it as a directional indicator. Rising yields suggest competition for capital. Falling yields may signal declining interest. Monitoring these patterns helps you understand which ecosystems are actively trying to attract users and which are losing traction.
DefiLlama, DEXTools, and DeFi Research Work Better Together
The strongest workflow is not DefiLlama alone. It is DefiLlama combined with execution and portfolio tools. DefiLlama helps you spot structural shifts. DEXTools helps you inspect pairs and liquidity. Tools like DeBank, Birdeye, and Zapper add wallet and ecosystem context.
This matters because no single dashboard gives you the full picture. The edge comes from combining them in sequence. Use DefiLlama to discover capital movement. Use DEXTools to inspect the tradable asset. Use other research dashboards to confirm that the move is not just a short-lived burst.
Use DefiLlama For
- Narrative discovery and rotation
- TVL and stablecoin flows
- Protocol comparison by fees and revenue
- Ecosystem-level research
- Yield and airdrop signal monitoring
Use DEXTools For
- Pair-level chart analysis
- Liquidity depth verification
- Short-term execution and timing
- Token-specific entry and exit planning
- Real-time market structure checks
Common Mistakes People Make With DefiLlama
The biggest beginner mistake is treating DefiLlama like a leaderboard of winners and losers. That misses the point. The platform is a context engine, not a one-click answer machine. A protocol at the top of the table is not automatically cheap, safe, or investable.
Another common mistake is ignoring timeframe. Short-term jumps can look dramatic, but what matters is whether growth is sustained, broad, and confirmed by multiple metrics. Fees, stablecoins, bridges, and category-level trends often tell the story much better than one snapshot.
- Do not confuse temporary incentives with organic demand
- Do not ignore fee quality while focusing only on TVL
- Do not assume rising TVL means a token is ready to buy
- Do not skip DEXTools when you need pair-level execution context
- Do not compare chains only by TVL without accounting for stablecoin composition
- Do not rely on 24-hour changes without checking 7-day and 30-day trends
Frequently Asked Questions
Related Tutorials
- CoinGecko Tutorial: Master Crypto Research and Market Analysis
- DeBank Tutorial: Track DeFi Portfolios and Wallets
- Birdeye Tutorial: Complete Solana DeFi Analytics Guide
- DexScreener Tutorial: Token Screening and Discovery
- CoinMarketCap Tutorial: Crypto Research and Tracking
- What Is f(x) Protocol? fxUSD and Leverage Without Liquidatio
- What Is Resolv (USR and RLP)? Delta Neutral Stablecoin Guide
Used properly, DefiLlama gives you a far better understanding of DeFi than price charts alone ever could. It helps you see where capital is arriving, where usage is real, and where narratives have actual structural support. If you pair that with DEXTools for execution, you go from reacting to headlines to researching like someone who understands how crypto flows actually work.
Related Guides
- Protocol Revenue vs TVL: Understanding DeFi Demand
- How to Use LlamaFolio: Track Wallet Holdings and DeFi Positions (2026)
- What Is DefiLlama: Complete DeFi Analytics Platform Guide (2026)
- How Stablecoins Keep Their Peg: Collateral Models, Depeg Risk and On-Chain Checks
- Utilization Rate vs TVL: The DeFi Metric That Matters