Crypto Chart Patterns Cheat Sheet (2026)
— By Tony Rabbit in Tutorials

Crypto chart patterns cheat sheet: head and shoulders, double tops, flags, triangles, and cup-and-handle, with breakout confirmation and stop rules.
Crypto chart patterns are not magic shapes that predict the future. They are repeatable structures that describe how buyers and sellers behave at certain price levels. Reading them correctly is less about memorizing names and more about understanding what each pattern is actually saying about supply, demand and volatility. This cheat sheet covers the patterns that show up most often, how to confirm them, and the traps that fool beginners.
Quick answer: Crypto chart patterns are recognizable price formations that tend to precede continuation or reversal moves. The high-value patterns split into two groups. Reversals (head and shoulders, double top, double bottom) signal a likely change of trend. Continuations (bull flag, ascending triangle, symmetrical triangle, cup and handle) signal that an existing trend is likely to resume. Patterns are not predictions. They are scenarios that need confirmation through breakout, volume and retest.
- Patterns describe behavior, not destiny. They map zones where buyers and sellers tend to fight predictably.
- Reversals signal a regime change. Head and shoulders, double tops and bottoms warn that the prevailing trend is exhausting.
- Continuations favor the existing trend. Flags, triangles and cups usually resolve in the trend's direction.
- Volume is the validator. A pattern without a volume spike on breakout is weaker than the chart suggests.
- Retest beats chase. The cleanest entries are usually after a successful retest of the broken level, not on the breakout candle itself.
Intent split
- This page is the pattern reference library: reversal and continuation structures, confirmation, targets, and stop logic.
- For the broader beginner skill of reading charts, read How to Read Crypto Charts for Beginners.
- For candle anatomy, wicks, and individual candle reading, read How to Read Crypto Candlestick Charts.
Why chart patterns work in crypto
Chart patterns appear in every market, but they appear especially clearly in crypto for three reasons. First, crypto markets are dominated by retail traders, who tend to react to visible levels in similar ways. Second, leverage and liquidations amplify the moves around those levels. Third, crypto trades 24/7, so structures have time to form without artificial open and close gaps interrupting them.
The result is that the same patterns that work on stocks and FX often print even more cleanly on liquid crypto pairs. They are not infallible, but on Bitcoin, Ethereum and the top liquid altcoins, the textbook setups still work most of the time when paired with structure and volume confirmation.
What a pattern is and is not
A chart pattern is a framework for organizing price action, not a guarantee. It tells the trader: "if price does X next, the most likely follow-through is Y." It does not say "Y will happen." A trader who treats the pattern as the trade itself, ignoring volume, structure, and macro context, will lose to traders who treat the pattern as one input among several.

Reversal patterns: when the trend is done
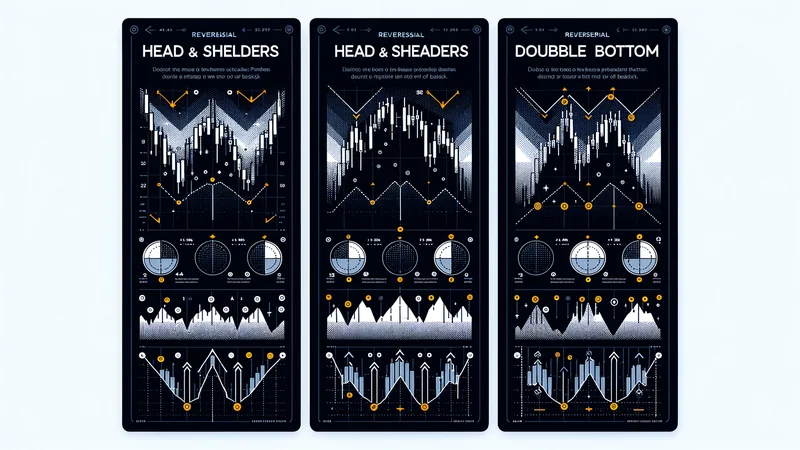
Reversal patterns appear at the end of a trend. They describe a moment when buyers (or sellers) lose control and the opposite side starts taking over. Three structures cover most of the high-quality reversal opportunities.
Head and shoulders
The head and shoulders is the most famous reversal pattern. It forms after an extended uptrend and shows three peaks: a left shoulder, a higher head, and a lower right shoulder, with a "neckline" connecting the lows between the peaks. The trade triggers when price breaks below the neckline with volume.
What it really represents is failed continuation. Buyers tried to push the trend higher, succeeded once at the head, and then could not produce another higher high. The right shoulder is the visible footprint of that exhaustion. The inverse pattern (inverse head and shoulders) prints at the end of downtrends and signals a likely bullish reversal.
Double top and double bottom
A double top is two clear peaks at roughly the same price level, separated by a pullback. A double bottom is the mirror image at the bottom. The pattern triggers on a break of the level between the two peaks (the support for a top, the resistance for a bottom).
The cleaner version of the trade waits for the break, then for a retest of the broken level from the other side. The retest filters out the most common fakeouts. A double top that breaks down and immediately retests as resistance, then rejects, is a textbook short setup.
Triple top and triple bottom
The triple variants behave like double tops and bottoms, but with three rejection points instead of two. They are rarer and usually carry more weight when they finally break, because the level has been defended longer. The same confirmation logic applies: break with volume, then a clean retest.
Continuation patterns: when the trend wants to resume
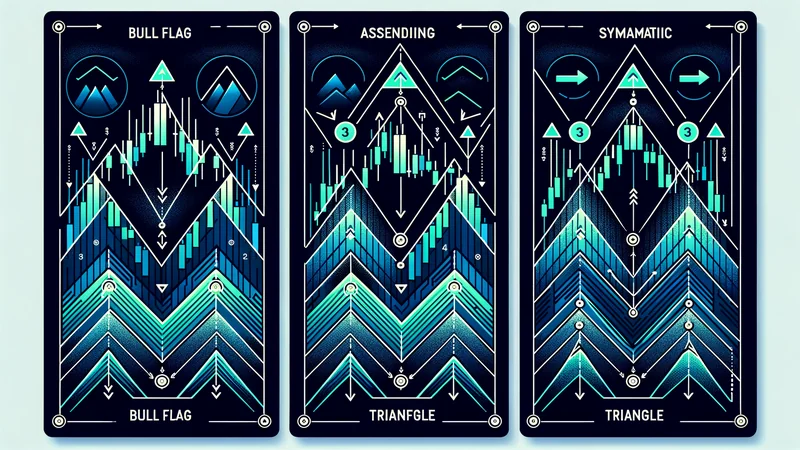
Continuation patterns appear inside an existing trend. They describe a pause: a moment when price compresses or pulls back without breaking the dominant direction. Most resolve in favor of the trend, which is why they are favorites of trend-followers.
Bull flag and bear flag
A bull flag forms after a sharp upward "pole" and prints a small descending or sideways consolidation. The bear flag is the mirror image after a sharp drop. The trade triggers when price breaks the upper boundary (for the bull flag) or the lower boundary (for the bear flag).
The flag works because it represents controlled profit-taking inside a trend, not a real reversal. Volume should drop during the consolidation and expand on the breakout. Without the volume signature, "flags" tend to be just chop that resolves randomly.
Ascending and descending triangles
An ascending triangle has a flat top and rising lows. Buyers keep pushing higher lows into a fixed resistance, eventually breaking above it. A descending triangle is the mirror image, with a flat bottom and falling highs. Sellers keep pressing lower highs into a fixed support and eventually break it.
These patterns are most reliable when they form in the direction of the prevailing trend (ascending triangle in an uptrend, descending triangle in a downtrend). Counter-trend triangles can work, but their failure rate is meaningfully higher.
Symmetrical triangle
The symmetrical triangle has lower highs and higher lows compressing into an apex. The pattern is neutral by itself: it can break either way. Traders use it as an "energy" pattern: the longer it compresses, the bigger the breakout move tends to be. The trigger is a clean break of either side with volume confirmation, and the trade direction follows the breakout, not a pre-decided bias.
Cup and handle
The cup and handle is a longer-form continuation pattern. It looks like a rounded "U" shape (the cup) followed by a small consolidation near the prior high (the handle). The trade triggers on a breakout above the handle's resistance with volume. It is most often seen on daily and weekly charts on Bitcoin and large-cap altcoins.
Reversal vs continuation in one comparison
| Family | Examples | Where it forms | Likely outcome |
|---|---|---|---|
| Reversal | Head and shoulders, double top/bottom, triple top/bottom | End of an extended trend | Trend change after neckline / level break |
| Continuation | Bull flag, ascending/descending triangle, cup and handle | Inside an existing trend | Trend resumes after consolidation breaks |
| Neutral | Symmetrical triangle, broadening formation | Anywhere | Direction decided by the breakout, not the pattern |
How to confirm a chart pattern
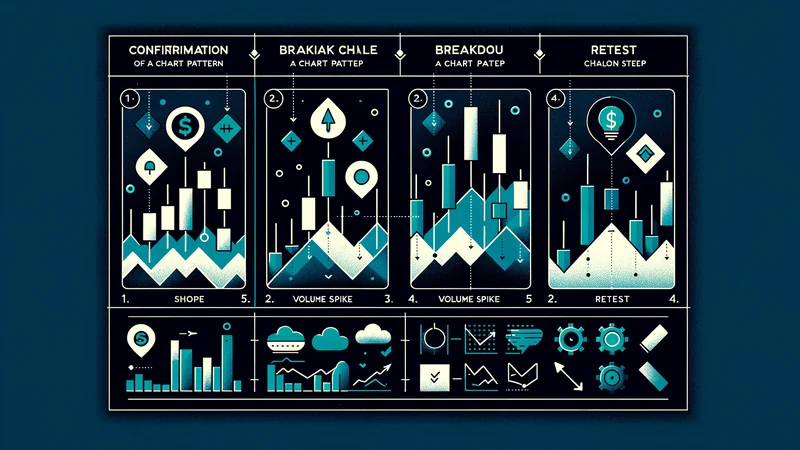
The fastest way to ruin a good pattern read is to enter on the pattern alone. A four-step confirmation routine filters most of the false signals.
- Pattern shape. The structure must be visibly clean on the timeframe you trade. If you have to squint to see it, the market does not see it either.
- Breakout candle. A decisive close (not just a wick) outside the pattern's boundary.
- Volume spike. Volume should expand on the breakout, not on the consolidation.
- Retest. Price returns to the broken level and rejects from the correct side.
That fourth step is what separates "I think this is a bull flag" from "this bull flag has actually triggered." Skipping the retest is the most common reason flag and triangle trades fail.
Timeframes that respect patterns
Not every timeframe is worth pattern-trading. The cleaner the structure, the more reliable the breakout, and structure cleans up as the timeframe expands.
- 1-minute and 5-minute: mostly noise. Patterns appear, but most are random fractals of larger moves.
- 15-minute and 1-hour: useful for intraday continuation patterns when paired with higher-timeframe context.
- 4-hour and daily: the cleanest swing-trading window. Most textbook patterns appear and resolve here.
- Weekly: macro-level patterns that often define multi-month trends, especially on Bitcoin and Ethereum.
Combining timeframes is what experienced traders do. A daily double bottom is more interesting if the weekly is already trying to base. A 1-hour bull flag is more interesting if the 4-hour is in a clean uptrend. Use the higher timeframe to pick a side, the lower timeframe to time the entry.
How to size targets and stops
Most patterns come with a built-in measured move. The technique is simple: measure the height of the pattern (top of head to neckline, height of the cup, depth of the flag pole) and project that distance from the breakout point.
Stops should sit on the other side of the structure, not at random round numbers. For a bull flag, the stop sits below the lower boundary of the flag. For a head and shoulders, the stop sits above the right shoulder. The goal is not to set a tight stop. The goal is to set an honest one that invalidates the pattern if hit.
Risk-reward sanity check
If the measured move target is 1R away and the invalidation level is also 1R away, the trade is a coin flip with extra steps. Strong patterns offer 2R or 3R potential against the invalidation. Walk away from setups that do not pass this test, even if the chart "looks" perfect.
Common chart pattern mistakes
- Pattern hunting. Forcing patterns onto random charts because you "want" something to trade.
- No volume context. Calling every triangle a bull flag without checking the volume profile.
- Ignoring the higher timeframe. A perfect 15-minute bull flag inside a daily downtrend usually loses.
- Counter-trend triangle bias. Assuming an ascending triangle in a strong downtrend "must" break up because of the shape.
- No retest discipline. Chasing the breakout candle and getting trapped on the first reversal.
A workflow you can copy on DEXTools and TradingView
The cleanest workflow combines liquidity screening, pattern marking, and confirmation in that order.
- Screen for liquid pairs. Use DEXTools and orderbooks to filter out illiquid charts where patterns are unreliable.
- Mark structure on the daily. Identify the trend, key levels, and any visible pattern in formation.
- Drop to 4-hour or 1-hour for entry. Look for breakout, volume confirmation and a retest.
- Cross-check with indicators. Use RSI and MACD for momentum confirmation, not as primary signals.
- Plan trade math. Measured move target, invalidation stop, position size that risks a fixed percent of the account.
Frequently asked questions
Do chart patterns actually work in crypto?
Yes, but only when applied to liquid pairs and on timeframes that filter out random noise. Daily and weekly patterns on BTC, ETH and top altcoins still play out reliably. Patterns on illiquid micro-caps almost never do, regardless of how clean the shape looks.
Which chart pattern is the most reliable?
There is no universal "most reliable" pattern, but inverse head and shoulders, bull flags, and ascending triangles in established uptrends consistently rank among the most consistent setups when paired with proper confirmation.
How much practice do I need to read patterns well?
Recognizing the shape is the easy part. Reading volume, structure context and confirmation requires hundreds of examples. A trading journal that logs each pattern setup, the outcome, and what was missed is the fastest way to internalize the difference between a textbook pattern and a real one.
Can I trade chart patterns without indicators?
Many traders do, using only price, volume and structure. Indicators add context but are not required. The key is that the absence of indicators does not become an excuse to skip volume and retest discipline.
What timeframe should beginners trade chart patterns on?
Daily and 4-hour charts are the most forgiving. They produce fewer false signals, allow time to plan trades, and remove the constant noise of low timeframes. Most beginner pattern losses come from forcing setups on the 5-minute chart.
Final takeaway: Crypto chart patterns work because they describe how traders behave at recognizable structures. The valuable skill is not memorizing the names but reading what each pattern says about supply, demand and volatility. Mark structure first, recognize the family second, and only enter after the breakout, volume and retest have all confirmed the read.
Disclaimer: This guide is for educational purposes only and does not constitute investment, financial, legal, or trading advice. Chart patterns can improve context, but they do not eliminate market risk.
Related Guides
- Candlestick Patterns Cheat Sheet: 35 Crypto Setups Explained (2026)
- Meme Coin Chart Indicators and Charting Sites (2026)
- Swing Trading Crypto for Beginners: Multi-Day Setups and Risk Rules (2026)
- What Are Candlestick Patterns in Crypto? Trading Guide 2026
- Telegram and Discord Crypto Scams: Common Patterns Explained
Frequently Asked Questions
What are crypto chart patterns?
Chart patterns are recognizable shapes that price forms on a chart, such as triangles, flags, and head and shoulders. Traders use them to anticipate possible continuation or reversal of a trend, though no pattern is guaranteed.
How do I confirm a chart pattern breakout?
A breakout is more reliable when price closes beyond the pattern boundary, ideally with rising volume. Many traders wait for a confirmed close or a retest of the broken level before acting to reduce false signals.
Are chart patterns reliable in crypto?
Chart patterns reflect probabilities, not certainties, and crypto's high volatility can produce more false breakouts than calmer markets. They work best combined with volume, trend context, and risk management rather than used alone.
What is the difference between a continuation and reversal pattern?
Continuation patterns, like flags and pennants, suggest the existing trend may resume after a pause. Reversal patterns, like double tops or head and shoulders, suggest the trend may be changing direction.