Volume Profile in Crypto Explained: POC, Value Area, HVN and LVN (2026)
— By Tony Rabbit in Tutorials

Learn what volume profile means in crypto, how POC and value area work, and how HVN and LVN help traders read acceptance, rejection, and price memory.
Volume profile is powerful because it answers a different question from normal volume bars. Instead of asking how much volume traded during each period of time, volume profile asks where that volume traded by price. That shift matters because traders do not only care about activity. They care about where the market actually accepted value.
Intent check: This page owns the concept explainer for volume profile itself. If you want the practical TradingView workflow, read How to Use Volume Profile in Crypto on TradingView.
Intent split
- This page owns the definition and core concepts of volume profile.
- For the TradingView workflow, read How to Use Volume Profile in Crypto on TradingView.
This is why volume profile helps with structure. It highlights the price levels where the market spent meaningful effort, where participation concentrated, and where future reactions may matter more. In crypto, where volatility can distort simple chart reading, that extra layer can be very useful.
Quick take
- Volume profile shows volume traded at price, not just volume traded over time.
- It helps identify zones of acceptance, rejection, and imbalance.
- Key concepts include POC, value area, HVN, and LVN.
- It is most useful for understanding market structure, not for blindly predicting every turn.
What Volume Profile Actually Shows
Volume profile plots volume horizontally along the price axis. The result is a visual map of where the market did the most business and where it did relatively little. This matters because price levels with heavy participation often behave differently from price levels that were crossed quickly.
That is why volume profile feels more structural than standard volume bars. It helps show where the market truly spent time and size, not just when trading activity happened during the session.

Visual Examples: How Volume Profile Is Read in Practice
Volume profile is easier to read once you stop treating it like a mystery side panel. It is simply telling you where the market did business and where it did not.
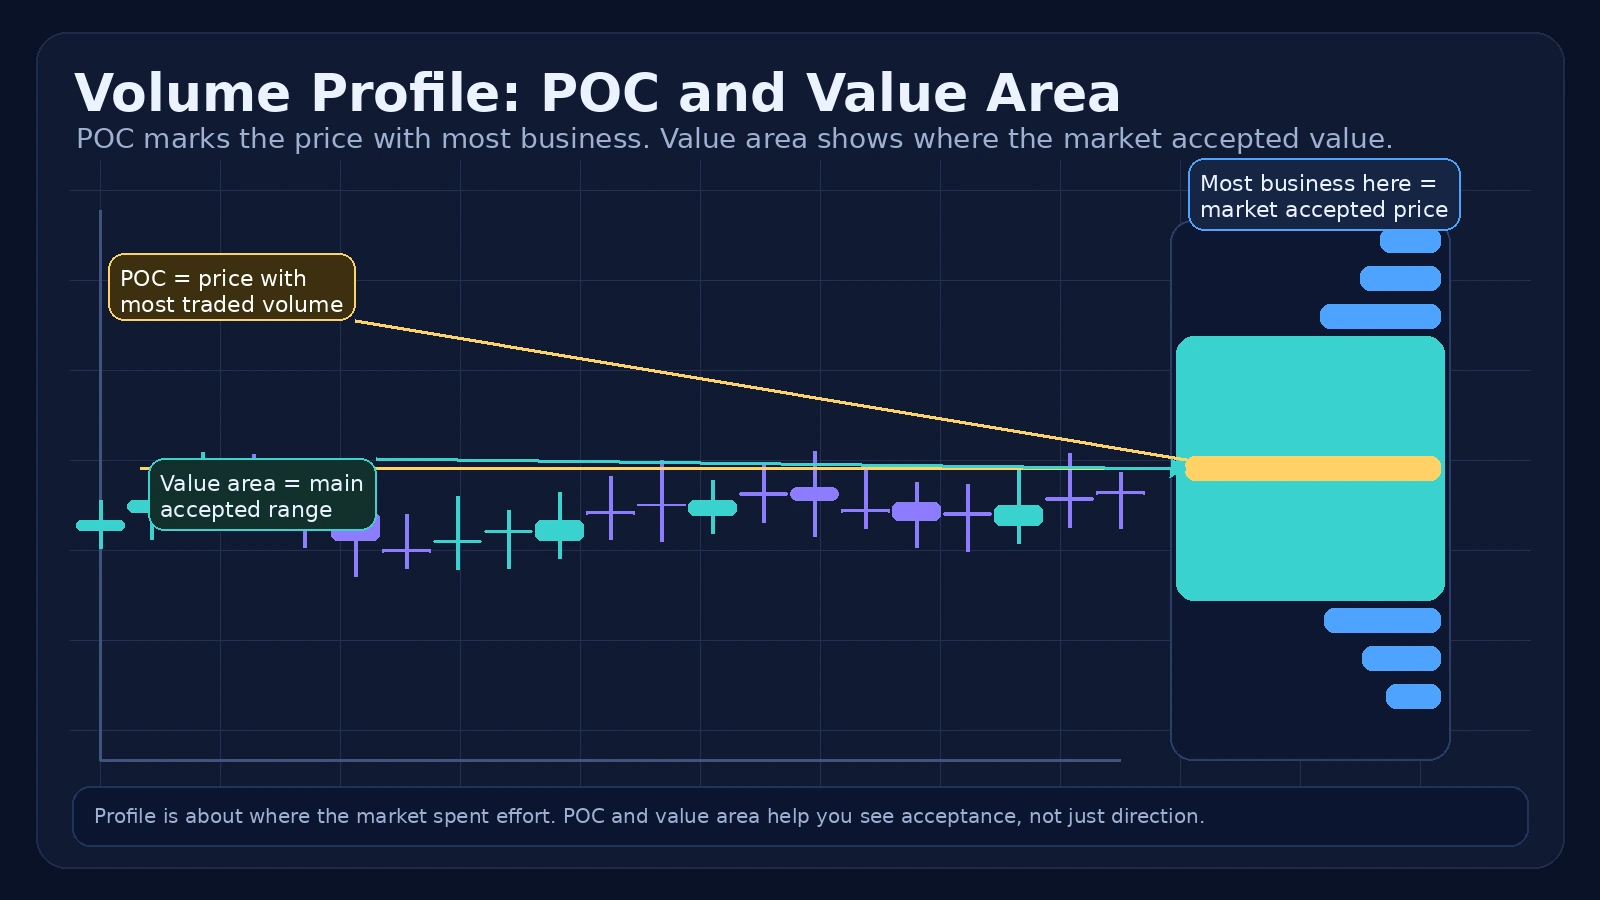
Example 1: POC and value area. In this kind of profile, the thickest bar marks the point of control. That is the price where the market did the most business in the chosen range. The value area wraps around the main accepted zone. When price is trading inside that area, the market is often interacting with prices it already accepted. When price is far outside it, traders start asking whether the move is being accepted or rejected.
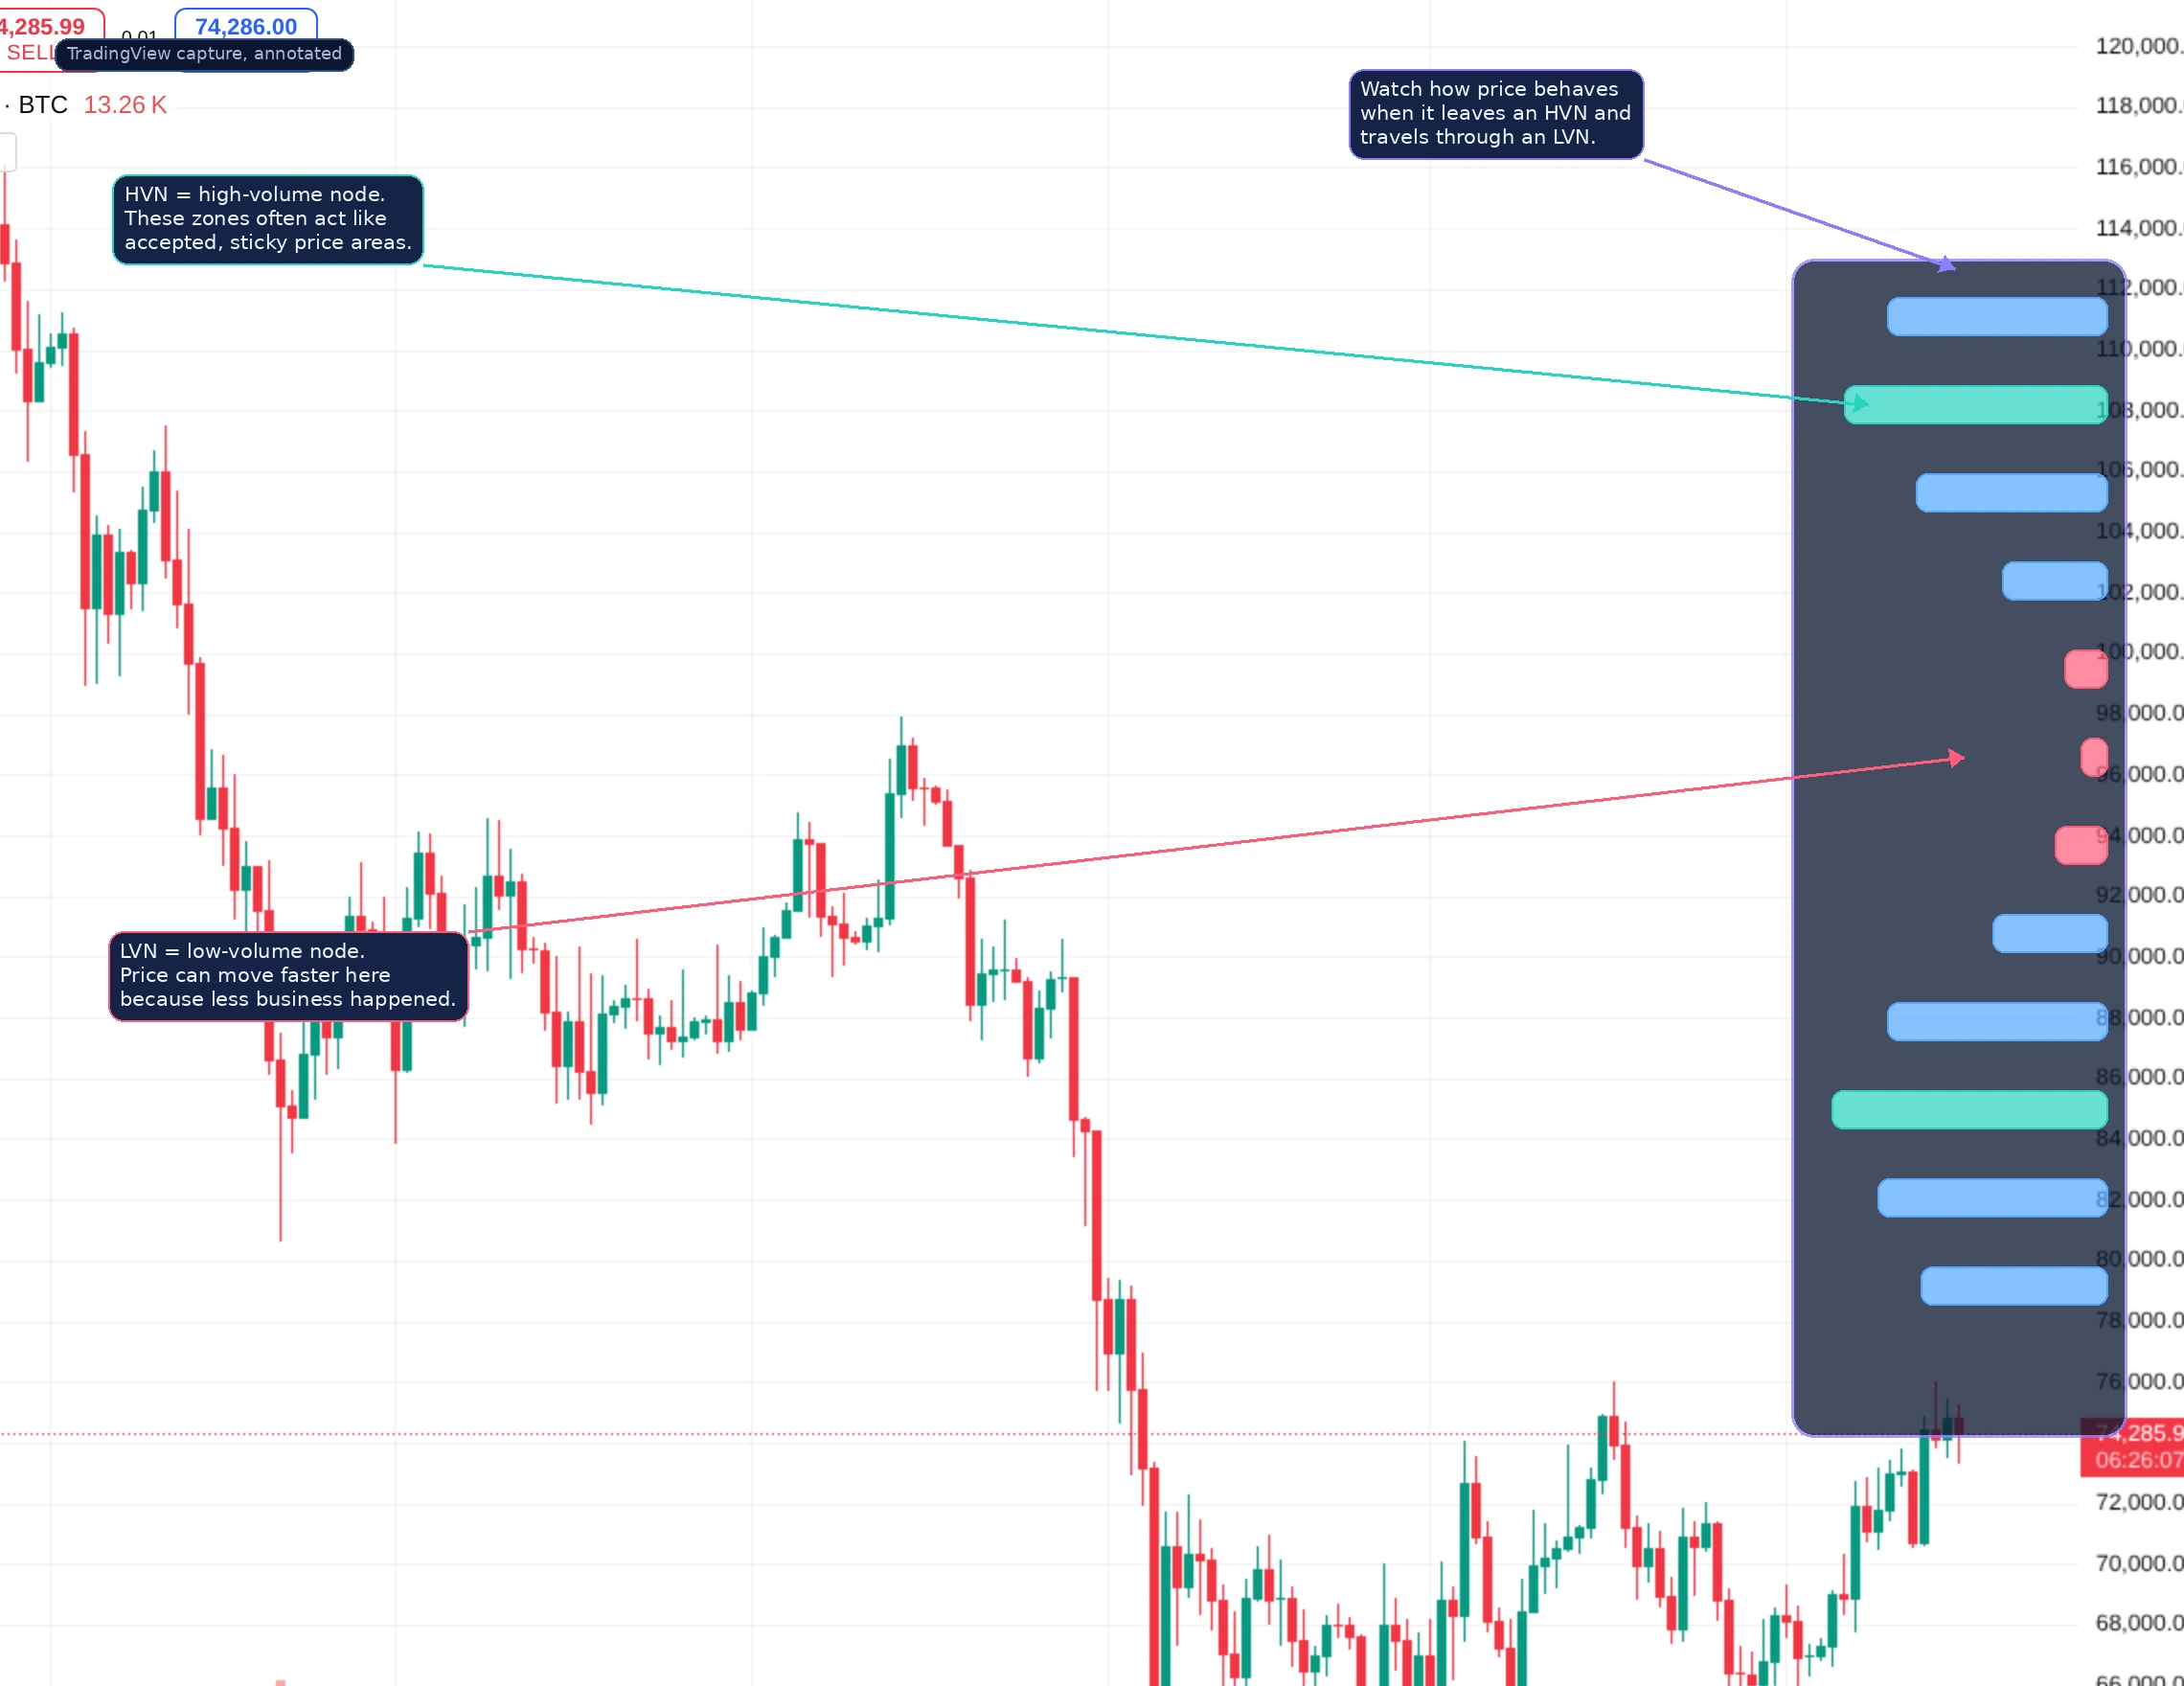
Example 2: HVN vs LVN. High-volume nodes usually represent prices where the market was comfortable trading. Low-volume nodes represent thinner areas where price moved through with less participation. That is why price can travel quickly through an LVN and then slow down or react once it reaches the next HVN. The profile is helping you see which zones are sticky and which zones are sparse.
The main lesson: volume profile is not just about drawing labels like POC and value area high. It is about understanding acceptance. Where did the market spend time? Where did it rush? Where does participation become thick again? Those answers are what make the profile useful.
How to read profile faster
- POC tells you where the market did the most business.
- Value area shows the main zone of acceptance.
- HVNs are often sticky because a lot of business happened there.
- LVNs can move faster because the market did less business in that area.
Volume Profile vs Normal Volume
This is the first distinction every beginner should get right.
- Normal volume bars show how much trading happened during each candle or period.
- Volume profile shows how much trading happened at each price level.
Both are useful, but they do different jobs. Standard volume helps you understand participation over time. Volume profile helps you understand participation across price. That difference is why profile tools are popular for identifying important zones on the chart.
Point of Control, Value Area, HVN, and LVN
These are the core terms that make volume profile useful.
- POC (point of control): the price where the most volume traded in the selected range.
- Value area: the range where most of the volume occurred.
- HVN (high volume node): a price area with heavy participation and acceptance.
- LVN (low volume node): a thinner area where price moved through with less participation.
In practice, HVNs often act like zones of acceptance or balance, while LVNs can act like thinner air where price may move faster because the market did less business there.
Why Traders Care About Acceptance and Rejection
The real value of volume profile is not memorizing labels. It is learning to think in terms of acceptance and rejection. If the market accepted price in an area before, that zone may matter again. If the market moved quickly through an area with little volume, that zone may behave differently on a revisit.
This is what makes volume profile useful for context. It can help show whether a move is pushing into accepted value, rejecting from it, or traversing a low-volume gap.
How Traders Use Volume Profile
Volume profile can be used in several practical ways:
- Identify important zones where the market previously accepted value.
- Spot thin areas where price may move faster than expected.
- Compare current price with the point of control or value area.
- Frame better support and resistance decisions using participation, not just candle memory.
This is why volume profile pairs well with charting tools like TradingView. It adds a layer of market structure that ordinary candles alone do not always show clearly.
Volume Profile vs VWAP
Beginners sometimes confuse volume profile with VWAP, but they solve different problems. VWAP gives you a session-based average price weighted by volume. Volume profile shows where volume concentrated across price levels.
In simple terms, VWAP helps you judge whether price is trading above or below the session's average flow. Volume profile helps you see where the market did the most business. Both are useful, but they are not interchangeable.
How Beginners Should Use It
- Start with a clean chart and basic structure.
- Add volume profile to see where the market accepted value.
- Mark the point of control and the main value area.
- Watch how price behaves when revisiting high-volume and low-volume zones.
- Use the profile as structure context, not as a guaranteed reversal system.
This keeps the tool useful instead of turning it into decorative noise.
Common Volume Profile Mistakes
- Overcomplicating the chart. Too many levels can make the profile unreadable.
- Ignoring the selected range. The profile depends on what data you measure.
- Treating every node as equally important. Context still matters.
- Using it without price action. A profile is strongest when combined with actual chart behavior.
Frequently Asked Questions
What is volume profile in crypto?
It is a chart tool that shows how much volume traded at specific price levels rather than only by time.
What is the point of control?
The point of control is the price where the most volume traded in the measured range.
What is value area?
Value area is the range where most of the volume occurred, often used to identify accepted price zones.
Why do traders use volume profile?
They use it to understand where the market accepted value, where price may react on revisits, and where low-volume gaps could move faster.
Related reading
Disclaimer: This article is for educational purposes only and does not constitute investment, financial, legal, or trading advice. Market profile tools are context aids and should never replace disciplined risk management.
Related Guides
- How to Use Volume Profile in Crypto on TradingView: Setup, Anchors and Execution (2026)
- Settlement Volume vs Transfer Count: Which Better Shows Real On Chain Value Movement?
- What Is MEV in Crypto? Maximal Extractable Value Explained (2026)
- What Is a Fair Value Gap (FVG) in Crypto? Trading Guide 2026
- What Drives XRP Price? Market Cap, Supply and Valuation