How to Use Dune Analytics: Build Better Crypto Dashboards and On-Chain Research (2026)
— By Tony Rabbit in Tutorials

Learn how to use Dune Analytics to explore on-chain dashboards, query blockchain data, track wallets, and find high-signal insights for better crypto research in 2026.
Dune Analytics is a powerful crypto research tool that visualizes on-chain data across various networks like Ethereum, Solana, and Arbitrum. It allows users to access thousands of community-built dashboards to track wallet behavior, protocol usage, bridge activity, and memecoin flows, transforming raw blockchain data into actionable charts and tables for better trading decisions.
Dune Analytics is one of the most powerful research tools in crypto for anyone who wants to understand what is actually happening on-chain instead of relying on surface-level commentary. It gives you access to thousands of community-built dashboards that visualize blockchain data across Ethereum, Solana, Base, Arbitrum, and many other networks. Whether you are tracking wallet behavior, protocol usage, bridge activity, or memecoin flows, Dune turns raw blockchain data into charts and tables you can actually use.
This tutorial shows you how to use Dune Analytics effectively in 2026, from finding high-quality dashboards to reading on-chain metrics and combining Dune research with DEXTools execution for better trading decisions.
What You Will Learn
- How to find high-quality dashboards instead of low-signal copycats
- How to read wallet activity, protocol usage, and volume trends on Dune
- How to judge whether an on-chain chart is actually actionable
- How to use Dune for narrative research and sector analysis
- How to combine Dune research with DexScreener and DEXTools for execution
- How to avoid the most common mistakes beginners make on Dune
Why Dune Analytics Matters for Crypto Research
Most crypto research tools focus on price. Dune focuses on behavior. That distinction is critical because price often lags activity. When a protocol starts gaining users, when a whale wallet begins accumulating, when bridge flows accelerate into a chain, those things happen on-chain before they show up on price charts. Dune gives you visibility into that layer.
The platform works because it organizes raw blockchain data into a queryable format and then lets analysts build visual dashboards on top of it. You do not need to write SQL to benefit from Dune. Thousands of dashboards already exist, built by professional analysts, protocol teams, and independent researchers. Your job is to find the right ones and read them well.
Start With Dashboards, Not SQL
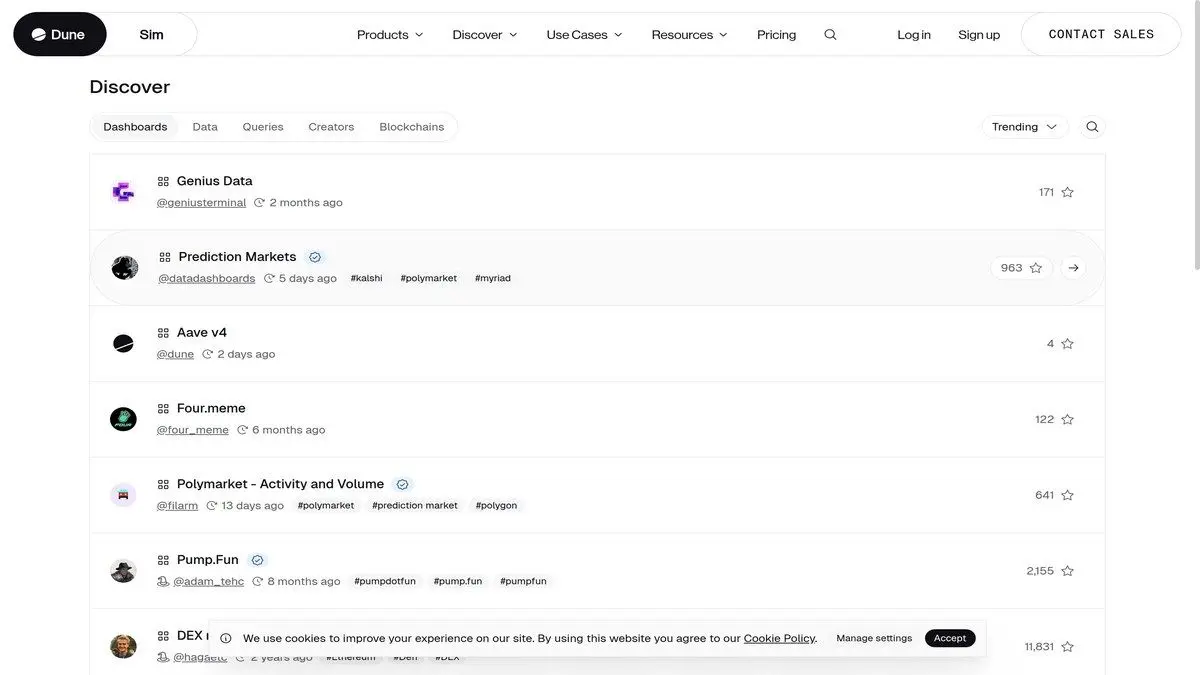
A lot of people assume Dune is only for analysts who write SQL. That is not true. If you are new, the easiest and most productive way to get value is by exploring dashboards built by other users. Many of the best dashboards already answer questions that traders and researchers care about every single day.
The Dune search function lets you find dashboards by protocol name, chain, or topic. The key is knowing what to look for and how to evaluate quality. Not all dashboards are equal. Some are well-maintained, frequently updated, and built by respected analysts. Others are abandoned, broken, or based on flawed queries.
- Search by protocol name to find dashboards for major DeFi apps, DEXs, and chains
- Search by narrative such as memecoins, stablecoins, perps, restaking, or bridges
- Check the last update date because stale dashboards can mislead you with old data
- Look at the author profile because strong dashboard creators tend to be consistent and transparent
- Compare multiple dashboards on the same topic to cross-validate conclusions
What to Look For in On-Chain Dashboards
The strongest Dune dashboards answer a very specific question. For example, are active traders increasing on a chain. Is one protocol gaining market share from competitors. Are a handful of wallets driving most of the volume. Are bridge inflows accelerating before price action follows.
When you open a dashboard, focus on these high-signal metrics rather than vanity numbers like total transaction count or all-time volume. Those big numbers look impressive but rarely help you make better decisions in real time.
High-Signal Metrics on Dune
- Daily active wallets - shows real user engagement, not just capital sitting idle
- Transaction count by cohort - separates whales from retail activity
- Bridge inflows by chain - early signal for ecosystem momentum
- Protocol market share changes - shows competitive dynamics
- New wallet participation over time - measures genuine growth versus recycled addresses
- Token holder distribution - concentration risk or healthy spread
How to Use Dune for Narrative Research
One of the most valuable applications of Dune is narrative research. Instead of relying on Crypto Twitter to tell you what is trending, you can verify it yourself. When people claim that a sector is booming, Dune can show you whether the activity actually supports that claim or whether it is mostly noise.
For example, if the AI token narrative is hot, search Dune for dashboards tracking AI protocol usage, token transfers, and holder growth. If you see rising activity across multiple projects, that confirms the narrative has substance. If the data is flat or concentrated in one token, you know the hype may be thinner than it appears.
This approach works for any sector including memecoins, liquid staking, real-world assets, gaming tokens, restaking, and DePIN. The key is to always ask whether the on-chain data supports what the market is saying.
Understanding Wallet Behavior and Whale Tracking
Dune is particularly strong for tracking wallet behavior at scale. While individual wallet trackers exist, Dune lets you see patterns across many wallets simultaneously. That means you can observe whether accumulation is broad or concentrated, whether selling pressure is coming from early holders or recent buyers, and whether new wallets are entering a token or only existing holders are shuffling positions.
Whale tracking dashboards are some of the most popular on Dune. They can show you what the largest holders of a specific token are doing, when they last moved tokens, and how their positions have changed over time. This is useful context before entering any position because it helps you understand who else is in the trade and what they might do next.
Using Dune Together With DEXTools and Other Research Tools
Dune is excellent for identifying what is changing on-chain. It is not the place where you should make execution decisions by itself. Once Dune shows you an interesting shift in user activity, protocol growth, or wallet behavior, the next step is to move to execution tools and verify the opportunity at the pair level.
DEXTools gives you the chart, liquidity depth, and real-time trading data you need to make an informed entry or exit. Tools like Birdeye add Solana-specific context. DeBank helps you track individual wallet portfolios. And CoinGecko provides broad market data and token fundamentals.
Dune Helps You Find
- Emerging usage trends
- Wallet behavior and accumulation patterns
- Chain and protocol growth signals
- Narrative verification with data
- Competitive dynamics between protocols
DEXTools Helps You Execute
- Pair-level chart analysis
- Liquidity depth checks
- Real-time pool monitoring
- Entry and exit planning
- Market structure assessment
Common Mistakes People Make on Dune
The biggest beginner mistake is treating every dashboard as reliable. Some dashboards have broken queries, outdated data, or flawed methodology. Always check when the dashboard was last updated and whether the author is credible. If you find conflicting data across two dashboards covering the same protocol, investigate why before drawing conclusions.
Another common mistake is confusing correlation with causation. Just because two on-chain metrics are moving together does not mean one is causing the other. Strong research requires context, multiple data points, and healthy skepticism.
- Do not trust a dashboard without checking when it was last updated
- Do not assume one chart tells the full story
- Do not confuse total metrics with marginal changes
- Do not skip pair-level verification on DEXTools before trading
- Do not ignore wallet concentration data when evaluating a token
- Do not rely on Dune alone without cross-referencing other tools
Frequently Asked Questions
Related Tutorials
Dune Analytics is one of the best places to build real conviction before the market narrative becomes obvious. Used properly, it helps you see underlying activity instead of just following social media noise. Combined with DEXTools for execution, it becomes a genuine edge for both research and trading decisions.
Related Guides
- Zapper Tutorial: Navigate DeFi Dashboards and Manage Multi-Chain Portfolios (2026)
- Arkham vs Nansen vs Dune: Best Onchain Analytics 2026
- How to Read On-Chain Data: Metrics, Wallet Flows and Dashboards (2026)
- Settlement Volume vs Transfer Count: Which Better Shows Real On Chain Value Movement?
- How to Use Glassnode: Read Bitcoin On-Chain Metrics Better (2026)