How to Use Crypto Bubbles: Spot Market Rotation (2026)
— By Tony Rabbit in Tutorials

Learn how to use Crypto Bubbles to track momentum, sector rotation and market heatmaps so you can spot stronger crypto moves faster in 2026.
Crypto Bubbles looks simple at first glance, but that is exactly why it works so well. In a market overloaded with dashboards, complex indicators, and information noise, it gives you a fast visual read on what is moving, what is cooling off, and where attention is rotating right now. If you learn to use it properly, it becomes one of the cleanest starting points for any trading session or market research workflow.
This tutorial shows you how to use Crypto Bubbles effectively in 2026, from reading the heatmap correctly to filtering by timeframe, using it for sector rotation research, and combining it with DEXTools for proper trade validation before you risk any capital.
What You Will Learn
- How to read bubble size, color, and relative strength quickly and accurately
- How to switch timeframes without misreading short-term noise as real momentum
- How to spot sector rotation and coordinated moves across the market
- How to build a fast research workflow with Crypto Bubbles and DEXTools
- What mistakes to avoid when using visual heatmaps for trading decisions
- How to combine Crypto Bubbles with CoinGecko and DefiLlama for deeper context
Why Crypto Bubbles Is Useful for Traders and Researchers
Most traders overcomplicate the first stage of their research process. Before you get into detailed charts, liquidity analysis, or on-chain data, you want a quick answer to a simple question: where is momentum right now? Crypto Bubbles gives you that answer in seconds.
The platform displays coins as bubbles. The size reflects market cap or relative significance in the view. The color shows direction, typically green for gains and red for losses. The visual layout makes it immediately obvious which sectors are strong, which are weak, and whether momentum is broad or concentrated. That kind of overview is difficult to get from a traditional table or watchlist.
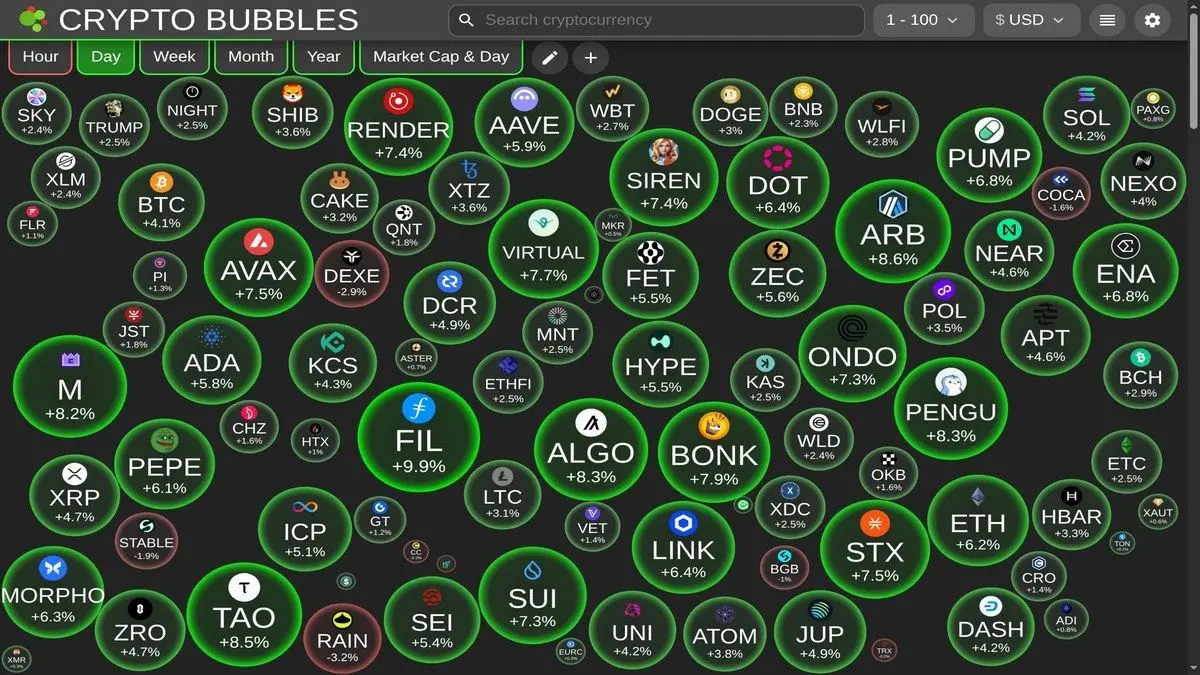
How to Read the Bubbles Properly
Each bubble represents a coin. The color shows direction. Green means the coin is up in the selected timeframe. Red means it is down. The size usually reflects relative market cap, meaning a giant green bubble matters more in market cap terms than a tiny one. But context still matters because small caps can move dramatically without affecting the broader market.
The most common beginner mistake is looking only at the biggest green bubble and assuming it is the best opportunity. That is wrong. A massive green bubble might mean the move is already extended. A cluster of medium-sized green bubbles in the same sector often tells a more interesting story because it suggests coordinated momentum rather than an isolated spike.
- Use 1h and 24h views together to compare short-term heat against broader trend direction
- Look for clusters where several related coins are moving together in the same direction
- Avoid chasing isolated spikes without checking liquidity and chart structure on DEXTools
- Sort by sector or watchlist when available to reduce noise and focus your attention
- Compare 7d view to see whether momentum is sustained or just a flash
How to Spot Market Rotation With Crypto Bubbles
One of the most valuable features of Crypto Bubbles is how quickly it shows rotation. If AI coins were hot yesterday but gaming, memecoin, or DeFi tokens are turning green together today, that shift is visible within seconds. You do not need to scroll through tables or check dozens of charts. The visual layout makes rotation obvious.
This matters because rotation is one of the most important dynamics in crypto markets. Capital rarely stays in one sector for long. It moves from narrative to narrative, from sector to sector, and from risk-on to risk-off depending on market conditions. Traders who can see rotation early have a significant timing advantage over those who only react when the trend is already mature.
Good Rotation Signals
- Multiple tokens in one sector turning green together
- Momentum holding across 1h, 24h, and 7d views simultaneously
- Leaders with enough liquidity for proper entries and exits
- Follow-through confirmed on DEXTools charts and pair analysis
- Stablecoin data on DefiLlama supporting the same direction
Timeframe Strategy: How to Avoid Getting Fooled
One of the trickiest parts of using Crypto Bubbles is choosing the right timeframe. The 1-hour view can look dramatically different from the 24-hour view, which can look different again from the weekly view. If you only check one timeframe, you risk misreading the market completely.
The best approach is to start with the 24-hour view for context. That shows you the dominant direction of the day. Then check the 1-hour view to see what is moving right now. If both views align, momentum is stronger. If they conflict, be careful because short-term moves against the daily trend are more likely to reverse.
Finally, use the 7-day view to check whether the momentum you are seeing is part of a larger trend or just a short-lived bounce. Trades backed by alignment across all three timeframes tend to have better risk-reward than trades based on a single timeframe.
Building a Real Research Workflow
Crypto Bubbles is ideal for discovery. DEXTools is ideal for decision-making. The best workflow uses them in sequence rather than isolation.
Start by scanning Crypto Bubbles for the market overview. Identify which sectors have broad momentum. Shortlist the 3 to 5 strongest candidates. Then open each one on DEXTools to inspect chart structure, liquidity depth, recent trading behavior, and pair health. Only then decide whether to enter.
For additional context, use CoinGecko for market cap and fundamental data, DefiLlama for ecosystem-level flows, and DexScreener for additional pair screening across chains.
Crypto Bubbles For
- Fast market scanning
- Sector heat and rotation
- Momentum discovery
- Visual market overview
- Timeframe comparison
DEXTools For
- Pair-level chart analysis
- Liquidity validation
- Trade timing and execution
- Pool and holder verification
- Market structure assessment
Common Mistakes to Avoid
The most dangerous mistake is chasing the biggest green bubble without doing any further research. A coin that is up 40% in 24 hours might look exciting on Crypto Bubbles, but it could also be extended, illiquid, or about to reverse. The visual appeal of a big green bubble can create a false sense of confidence.
Another common mistake is ignoring the red bubbles. Sometimes the most interesting opportunities come from coins that were recently red but are starting to turn. Mean reversion and rotation setups often begin in sectors that were weak before strength returned.
- Do not chase the biggest mover without checking charts and liquidity
- Do not use only one timeframe for decision-making
- Do not ignore sectors that were recently weak but are starting to turn
- Do not treat Crypto Bubbles as a trading system by itself
- Do not skip DEXTools verification before entering any position
- Do not confuse short-term noise with real sector rotation
Frequently Asked Questions
Related Tutorials
Crypto Bubbles is simple, but simplicity is part of the edge. It helps you read market heat fast, avoid tunnel vision, and catch sector rotation before most traders even organize their screens. Pair it with DEXTools for execution and you go from a casual market scan to a practical momentum-based research workflow that actually helps you make better decisions.
Related Guides
- Fake Volume vs Real Demand: How to Spot Artificial Momentum in DeFi Trading
- Deposit Growth vs Borrow Growth in DeFi: Guide
- Bitcoin Dominance (BTC.D) Explained: How Traders Read Rotation (2026)
- What Is Altseason? Altcoin Rotation Signals and Cycle Phases (2026)
- DEX Net Inflows vs. Trading Volume: Capital Rotation?