What Are Candlestick Patterns in Crypto? Trading Guide 2026
— By Tony Rabbit in Tutorials
Learn how candlestick patterns work in crypto trading, from single-candle dojis and hammers to engulfing setups and morning stars, plus the principles that make them reliable.
Candlestick patterns are one of the most widely used tools in crypto technical analysis. Each candle on a chart packs four prices into a single shape, and the way those candles line up can hint at whether buyers or sellers are gaining the upper hand. For traders watching volatile tokens on platforms like DEXTools, reading candles is a quick way to gauge sentiment without drowning in indicators.
This guide explains what candlestick patterns are, how a candle is built, and the most common single, two, and three candle formations you will run into. We will also cover the principles that separate a useful signal from random noise. None of this is financial advice, and patterns are probabilities rather than guarantees, so treat them as one input among many.
Anatomy of a Candlestick
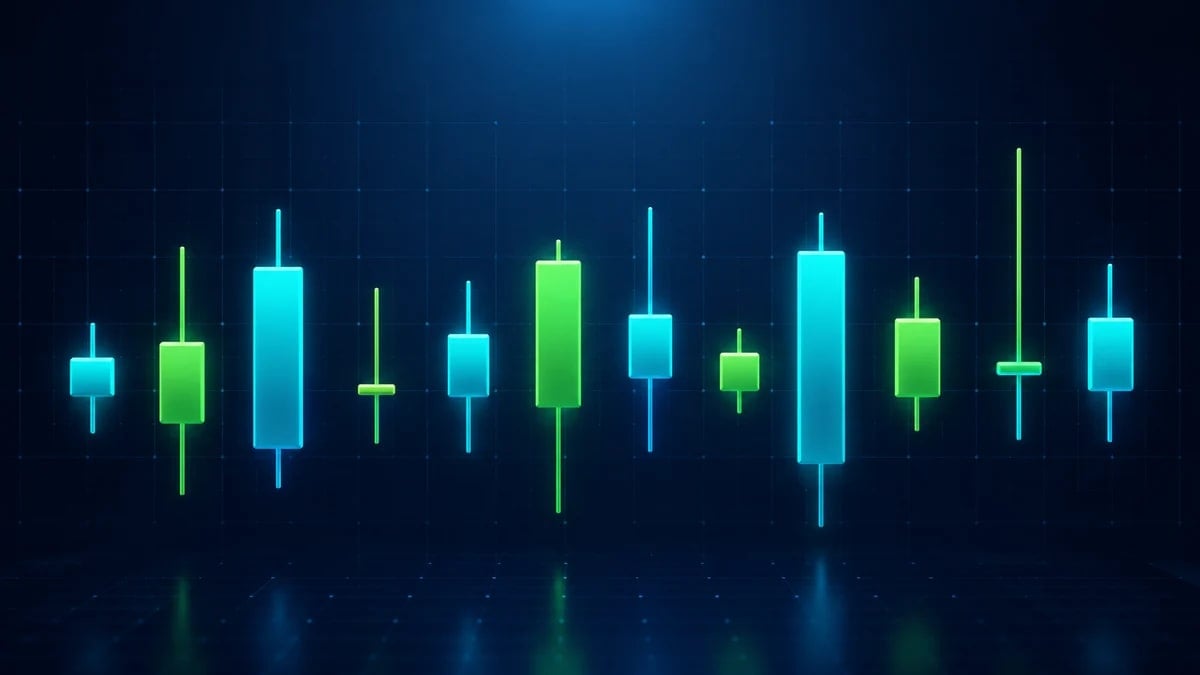
Every candlestick represents price action over a fixed period, such as one minute, one hour, or one day. It shows four data points: the open, the close, the high, and the low for that period.
- Real body: the thick part of the candle between the open and the close. A wide body means a strong, decisive move, while a narrow body signals hesitation.
- Wicks (shadows): the thin lines above and below the body. The upper wick reaches the high, the lower wick reaches the low. Long wicks show that price was rejected at those extremes.
- Bullish candle: the close is above the open, usually drawn in green or white. Buyers controlled the period.
- Bearish candle: the close is below the open, usually drawn in red or black. Sellers controlled the period.
Once you can read a single candle at a glance, the patterns built from one, two, or three candles become much easier to interpret. The grouping below moves from the simplest formations to the more complex ones.
Single Candle Patterns
Single candle patterns tell a story from one period alone. They are fast to spot but generally need confirmation from the next candle before you act on them.
Doji
A doji forms when the open and close are almost identical, leaving a tiny or nonexistent body with wicks on both sides. It reflects indecision, a balance between buyers and sellers. After a strong trend, a doji can warn that momentum is fading, but on its own it only signals a pause.
Hammer and Inverted Hammer
A hammer has a small body near the top of the range and a long lower wick at least twice the body length. Appearing after a downtrend, it suggests sellers pushed price down but buyers stepped in to close near the open, a potential bullish reversal. The inverted hammer is the mirror image, with a long upper wick, and it carries a similar bullish hint when it shows up at the bottom of a decline.
Shooting Star and Hanging Man
The shooting star is the bearish counterpart that appears after an uptrend. It has a small body near the lows and a long upper wick, showing that buyers lost control late in the period. The hanging man looks like a hammer but forms at the top of an uptrend and warns of a possible bearish reversal.
Marubozu
A marubozu is a candle with little or no wick, meaning price opened at one extreme and closed at the other. A bullish marubozu shows relentless buying, while a bearish one shows steady selling. It signals strong conviction in the direction of the body.

Two Candle Patterns
Two candle patterns add context by comparing the most recent candle to the one before it. The relationship between the two bodies is what gives these formations their meaning.
- Bullish engulfing: a small bearish candle followed by a larger bullish candle whose body fully covers the previous one. It points to a shift toward buyers.
- Bearish engulfing: the opposite, where a large bearish candle swallows the prior bullish body, hinting that sellers have taken over.
- Harami: a small candle whose body sits inside the previous larger body. It signals that the prior trend is losing steam and a reversal may be near.
- Piercing line: a bullish two candle reversal where a strong green candle closes above the midpoint of the previous red candle.
- Dark cloud cover: the bearish mirror of the piercing line, where a red candle opens higher but closes below the midpoint of the prior green candle.
- Tweezer tops and bottoms: two candles with matching highs (tops) or matching lows (bottoms), showing that price tested a level twice and was rejected.
Because two candle patterns already include a measure of follow through, many traders find them more reliable than single candle signals, though context still matters.
Three Candle Patterns
Three candle patterns require more confirmation to form, which can make their signals stronger. The middle candle often acts as the turning point.
- Morning star: a bullish reversal made of a large bearish candle, a small indecisive candle, then a strong bullish candle. It often marks the end of a downtrend.
- Evening star: the bearish version, with a large bullish candle, a small candle, then a strong bearish candle, suggesting a top.
- Three white soldiers: three consecutive long bullish candles, each closing higher, reflecting sustained buying pressure.
- Three black crows: three consecutive long bearish candles, each closing lower, reflecting sustained selling pressure.
Continuation Patterns
Not every pattern signals a reversal. Continuation patterns suggest the existing trend will resume after a brief pause. The rising three methods is a bullish example: a long green candle, a few small candles that drift lower without breaking the range, and then another long green candle that pushes higher. The falling three methods is the bearish mirror. These remind you that a quiet stretch on the chart does not always mean the trend is over.
Principles for Reading Candles Well
A pattern in isolation means little. The following principles separate a high quality signal from a coincidence, and they apply across every formation above.
- Context matters: a hammer at a clear support level or after an extended downtrend carries far more weight than one floating in the middle of a range. Always note where the pattern forms relative to support, resistance, and the prevailing trend.
- Wait for confirmation: let the next candle and trading volume validate the signal. A bullish engulfing backed by rising volume is more convincing than one on thin volume.
- Higher timeframes are more reliable: a pattern on the daily or four hour chart usually outweighs the same shape on the one minute chart, where noise dominates.
- Patterns are probabilities: no formation works every time. Think in terms of edge and frequency, not certainty.
- Combine with other tools: pair candles with moving averages, support and resistance, or momentum indicators to build a fuller picture. On DEXTools you can scan token charts and overlay this analysis quickly.
- Manage risk: use position sizing and a clear invalidation level so a single bad read does not damage your account.
Conclusion
Candlestick patterns give crypto traders a compact way to read the ongoing tug of war between buyers and sellers. Start by mastering the anatomy of a single candle, then learn to recognize the core single, two, and three candle formations, from the doji and hammer to engulfing setups and morning stars. Continuation patterns round out the picture by showing when a trend is simply catching its breath.
The real skill is not memorizing shapes but applying them with discipline: respecting context, waiting for confirmation, favoring higher timeframes, and combining candles with other tools and solid risk management. Used that way, candlestick patterns become a dependable part of your analysis rather than a crystal ball. They describe probabilities, not promises, and they are best treated as one piece of a broader process. This article is educational and not financial advice.
Related Guides
- Candlestick Patterns Cheat Sheet: 35 Crypto Setups Explained (2026)
- What Is an Evening Star Pattern in Crypto Trading? 2026 Guide
- What Is a Spinning Top Candlestick in Crypto Trading? 2026 Guide
- What Is a Shooting Star Candlestick in Crypto Trading? 2026 Guide
- What Is a Morning Star Pattern in Crypto Trading? 2026 Guide
Frequently Asked Questions
What are candlestick patterns in crypto trading?
Candlestick patterns are formations made by one or more price candles that traders use to read potential market sentiment. Each candle shows the open, high, low, and close for a period.
What does a doji candlestick mean?
A doji forms when the open and close are very close together, creating a small or nonexistent body. It often signals indecision between buyers and sellers and can hint at a possible pause or reversal.
What is a bullish engulfing pattern?
A bullish engulfing pattern appears when a larger up candle fully covers the body of the previous down candle. Traders often read it as a sign that buying pressure may be taking over.
Are candlestick patterns reliable on their own?
Candlestick patterns are more meaningful when read alongside trend, support and resistance, and volume rather than in isolation. They reflect probabilities, not certainties, so risk management remains important.