Build a Crypto Price Tracker in Google Sheets (2026)
— By Whatsertrade in Tutorials
Build a crypto price tracker in Google Sheets using free APIs, live prices, formulas, watchlists, and a simple dashboard for portfolio tracking.
This guide is for building a crypto price tracker in Google Sheets with spreadsheets and formulas. If you want quick scenario tools instead, use our Crypto Profit Calculator or Crypto DCA Calculator.
Tracking crypto prices does not have to be complicated. Many investors start by using portfolio apps, exchange dashboards, or market websites, but these tools often come with limits. Some do not support every coin, some require paid plans, and others do not let you organize the data in the way you want.
The Flexibility of Google Sheets for Crypto Tracking
Google Sheets offers a simple alternative for building a crypto price tracker. It allows you to create a custom tool that fits your own portfolio, watchlist, and research process. By integrating a free crypto API, you can monitor prices, compare assets, calculate portfolio value, and keep notes in one place.
Why Choose a Google Sheets Tracker?
A crypto price tracker in Google Sheets is especially useful for investors seeking flexibility. Track Bitcoin, Ethereum, stablecoins, altcoins, and tokens under research. Additionally, you can separate coins you already own from those on your watchlist for future entries.
The main advantage of using Google Sheets is control. Rather than relying on a fixed app layout, you decide what information matters. Some users only want current prices, while others monitor profit and loss, percentage changes, portfolio allocation, buying targets, or risk notes. A spreadsheet provides room to build all of that gradually.
Starting Your Google Sheets Crypto Tracker
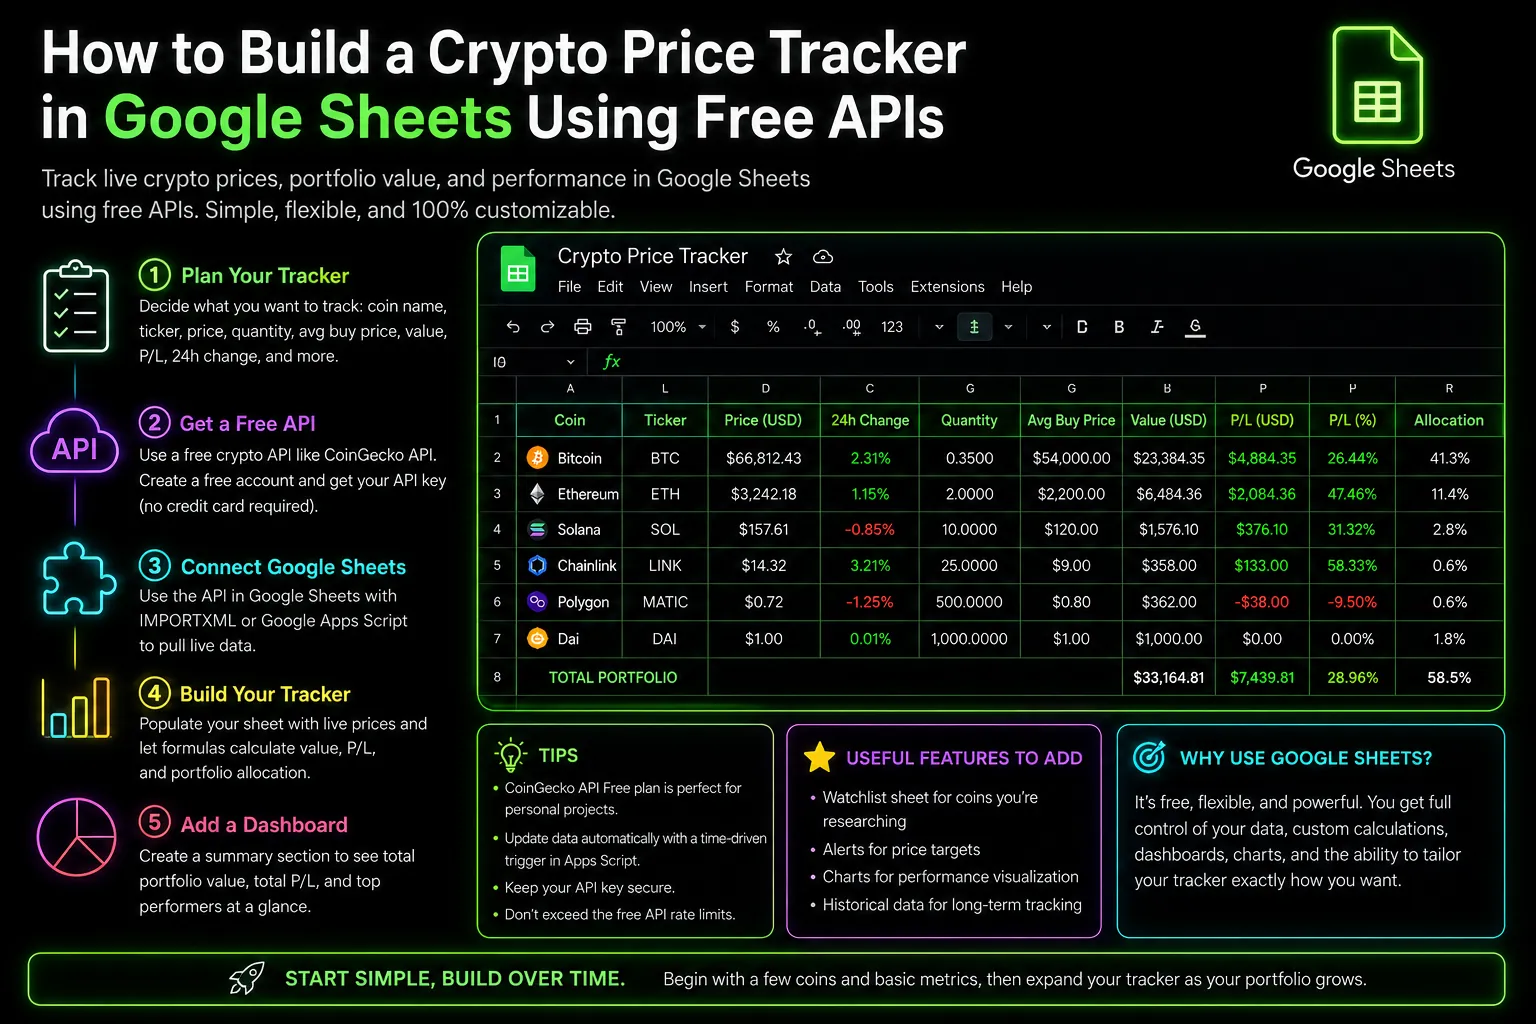
The first step is to decide what you want your tracker to do. A basic version should include the coin name, ticker symbol, current price, quantity owned, average buy price, current portfolio value, and profit or loss. A more advanced version can include a 24-hour price change, market cap, volume, portfolio allocation, and personal notes.
Organizing Your Data Efficiently
Once you have planned the structure, create a new Google Sheets document and name it clearly. A simple name like Crypto Price Tracker or Crypto Portfolio Dashboard works well. The goal is to keep the spreadsheet easy to understand, especially if you plan to use it every day.
Adding Your Crypto Assets
Next, add the crypto assets you want to follow. Start with a small number of coins. It’s better to build a clean tracker for ten or twenty assets than a messy one with hundreds of tokens. You can always expand later.
Integrating Free Crypto APIs
To bring live prices into your spreadsheet, you need a free crypto API. A crypto API is a data service providing market information such as current price, trading volume, market capitalization, and price changes. Some APIs require an account and API key, while others allow basic free access. For a beginner tracker, free access is usually enough.
Understanding API Limitations and Accuracy
When using free APIs, accuracy and limits matter. Some APIs update faster than others. Some support more tokens. Some may limit the number of requests you can make per minute or per day. This is why a lightweight spreadsheet is often better than trying to track too much data at once.
Calculating Portfolio Value and More
After connecting your spreadsheet to a price data source, your tracker can begin to calculate useful information. The most important calculation is the current portfolio value, based on how many units of each coin you own and the current market price. Once you know the current value, you can compare it with your original cost and estimate profit or loss.
A good tracker should also include a notes section. Crypto investing isn’t solely about numbers. You may want to record why you bought a coin, what risk factors you observed, what catalyst you are monitoring, or what price level could make you reconsider your position. Over time, these notes can become more valuable than the price data itself.
Maintaining a Watchlist for Future Investments
Another useful section is a watchlist for tracking coins you do not own yet. A watchlist helps you avoid emotional buying. Instead of chasing every trending token, write down why a coin interests you, what price you are waiting for, and what conditions need to improve before you consider buying.
Creating a Handy Dashboard
A dashboard can make the tracker easier to use. Instead of looking at every row, create a simple summary that shows total portfolio value, total profit or loss, best-performing asset, worst-performing asset, and largest position. This provides a quick overview of your crypto portfolio without needing to analyze every detail.
Avoiding Common Mistakes
Several common mistakes should be avoided. The first is tracking too many coins. A tracker should help you make better decisions, not overwhelm you. The second mistake is using incorrect token identifiers; many crypto assets share similar ticker symbols, so ensure your data source pulls the correct asset. The third is storing sensitive information in the spreadsheet; never store private keys, seed phrases, exchange passwords, or wallet recovery details in Google Sheets.
A Google Sheets crypto tracker is not a replacement for professional tax software or advanced portfolio management tools. It won’t automatically classify every transaction or calculate complex tax obligations. However, it’s excellent for monitoring prices, organizing research, and maintaining a clear view of your holdings.
Starting Simple with Your Tracker
For beginners, the best approach is to start simple. Track a few major assets, add your quantities and buy prices, then monitor current value and performance. Once you are comfortable, you can add more features such as watchlists, dashboards, portfolio allocation, and notes.
The biggest benefit of building your own crypto price tracker is that it reflects your personal strategy. Some focus on long-term holdings, others on short-term price movements. Whether you track blue-chip assets or research low-cap tokens, Google Sheets lets you build the tracker around your own needs.
At the end of the day, a crypto price tracker isn’t just a spreadsheet. It’s a decision-making tool that keeps you organized, helps you avoid emotional trades, and offers a clearer understanding of your portfolio. With Google Sheets and free crypto APIs, anyone can create an effective crypto dashboard without paying for expensive software.
How to Bridge Crypto Between Chains: Complete Cross-Chain Tutorial 2026 How to Use 1inch: Complete DEX Aggregator Swap Tutorial (2026) How to Use OKX Web3 Wallet: Multi-Chain DeFi Hub Guide (2026)Related Guides
- What Is QuickNode: RPC Infrastructure, Elastic APIs and Web3 Build Workflows (2026)
- How to Use Dune Analytics: Build Better Crypto Dashboards and On-Chain Research (2026)
- How to Build a Crypto Portfolio: Complete Allocation Guide (2026)
- What Is a Wallet Tracker in Crypto? Complete Beginner Guide (2026)
- What Is a Crypto Portfolio Tracker? Complete Beginner Guide (2026)