How to Evaluate Tokenomics: Supply, Emissions and Unlock Risk Guide (2026)
— By Tony Rabbit in Tutorials
A practical tokenomics due diligence framework covering supply, distribution, vesting, emissions, utility, and insider unlock risk before you buy.
For the complete, up-to-date guide, read our full guide here.
Intent check: This page owns the tokenomics evaluation framework. If you want the broader definition-first explainer on token economics, read What Is Tokenomics: Complete Guide to Token Economics (2026).
Tokenomics is the part of a crypto project that quietly decides whether holders are rewarded or slowly diluted. The headline narrative attracts buyers. The chart attracts traders. But the way the token is supplied, distributed, unlocked, and used over time is what separates a project that compounds value for its community from one that pumps once and then bleeds for years. Reading tokenomics well is one of the highest-leverage skills in crypto, and it is also one of the least taught.
Quick answer: Tokenomics in crypto is the combined design of a token's supply, distribution, utility, vesting, and emissions. It defines how many tokens exist now, how many will exist later, who holds them, when those holders can sell, what the token actually does inside the ecosystem, and how new tokens are created or burned over time. Strong tokenomics align the team, investors, and community. Weak tokenomics quietly transfer value from holders to insiders.
- Supply tells you how big the cake is. Circulating supply, max supply, and fully diluted valuation set the real price context.
- Distribution tells you who got the cake. Concentrated insider allocations are a warning, even when the chart looks great.
- Utility tells you why the cake exists. A token that does nothing inside the ecosystem is mostly a speculation chip.
- Vesting tells you when the cake gets cut. Cliffs and unlock schedules drive months of selling pressure.
- Emissions tell you how the cake grows. Inflation that exceeds organic demand quietly erodes price even on good projects.
What tokenomics actually is
Tokenomics is the design layer that controls how a token behaves over its lifetime. It includes how the token was created, how it is distributed, how it can be used, when various holders can sell, and how the supply changes through emissions, burns, or buybacks. Each of those elements interacts with the others, which is why a good tokenomics review never looks at a single number in isolation.
For a beginner, the difference between price and tokenomics is the most important mental model to install. Price is what the token trades for right now. Tokenomics is the structure that decides how price is likely to behave under different scenarios. Two tokens at the same price can have very different futures simply because their supply curves and unlock schedules behave differently as time passes.
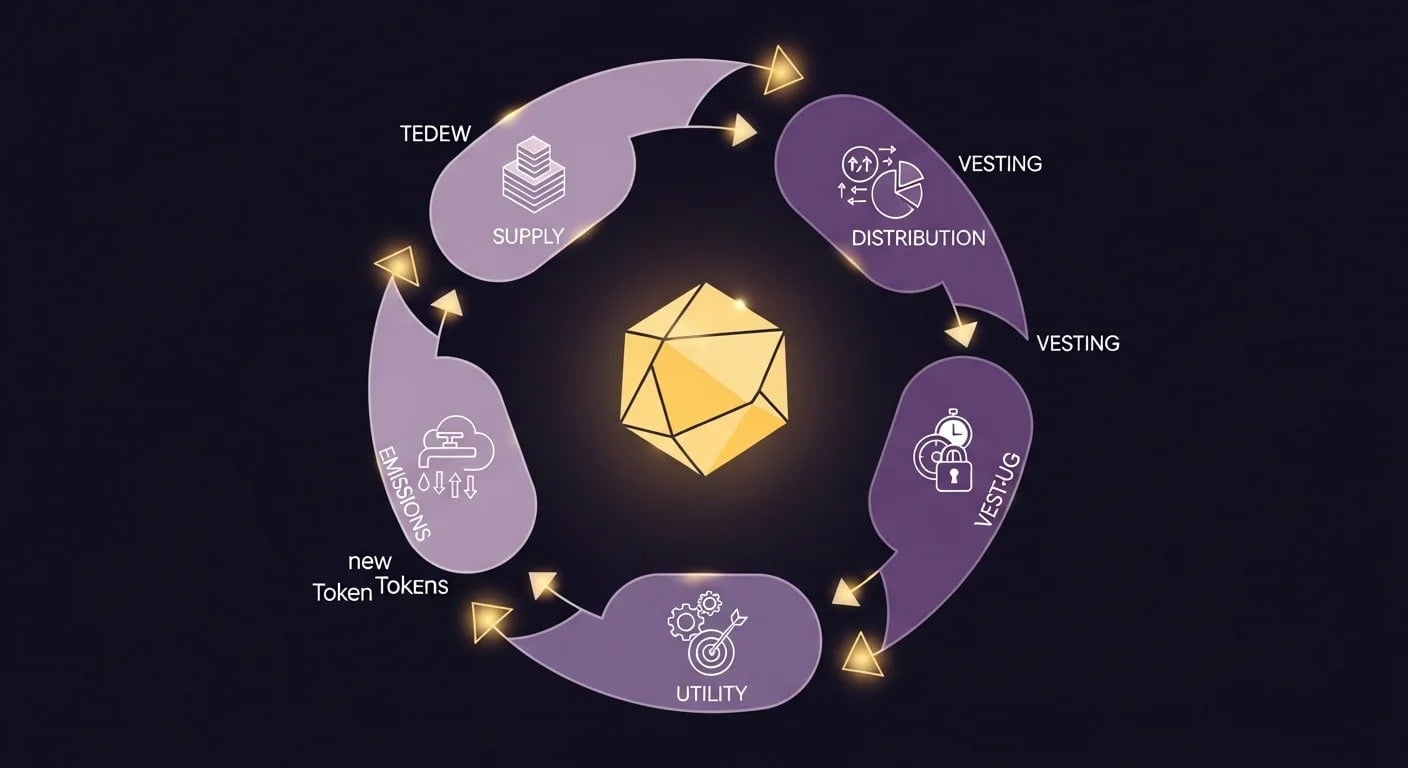
Supply, distribution, utility, vesting, emissions
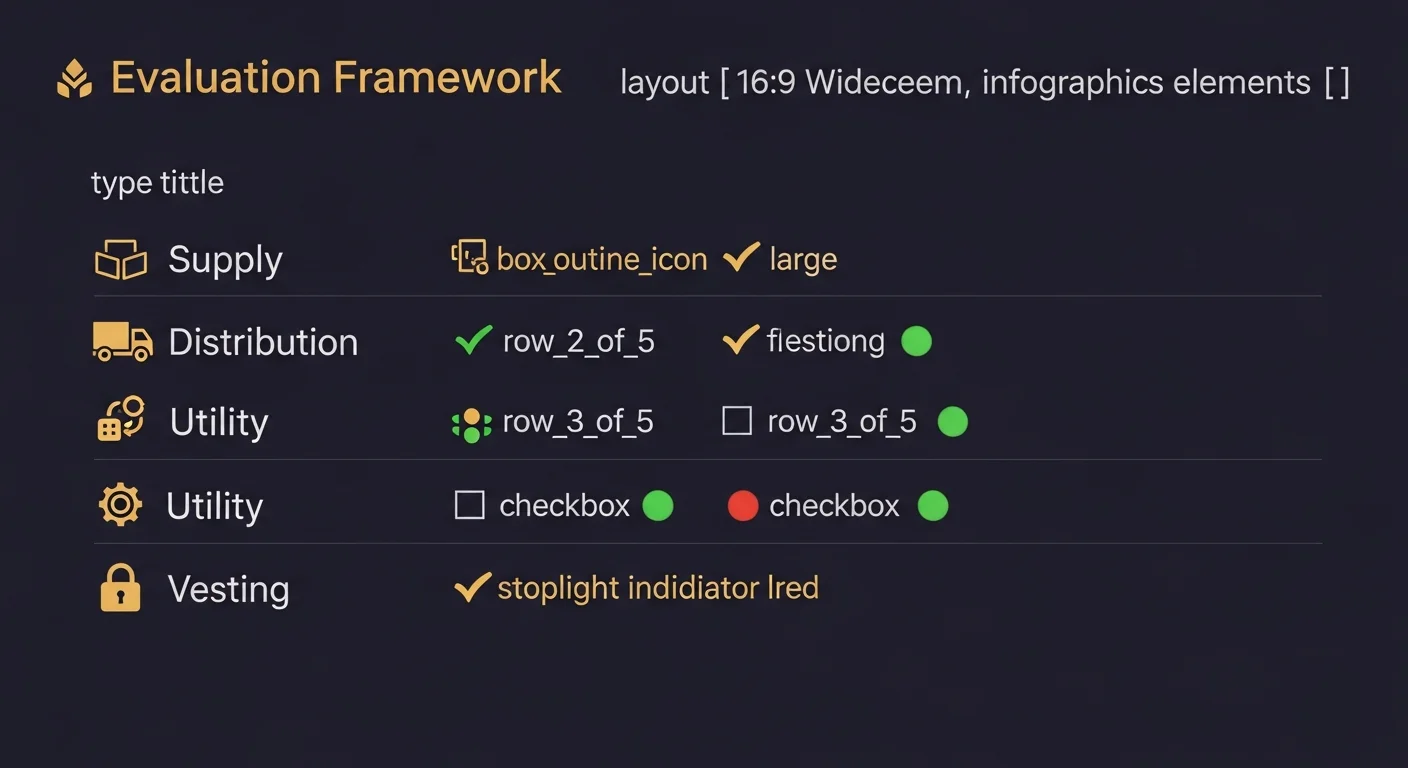
The five components every reader should be able to pull up from memory are supply, distribution, utility, vesting, and emissions. Supply covers circulating, total, and max supply. Distribution covers who holds the supply and in what proportions. Utility covers what the token actually does. Vesting covers the timing of token unlocks for the team, investors, and other allocations. Emissions cover how new tokens enter circulation through staking rewards, liquidity mining, or scheduled releases.
Reading those five components together is what separates a real evaluation from a vibe check. A token can have a great narrative, an active community, and aggressive marketing, and still be set up to dilute holders for the next two years because its emissions schedule is designed to subsidize early insiders.
Tokenomics is design, not magic
Beginners sometimes treat tokenomics as if it were a hidden recipe that decides whether a project will succeed. It is not magic. It is design. Even a perfectly designed token can fail if the product underneath has no users. Even a poorly designed token can pump for a while if narrative momentum is strong enough. Tokenomics shape probabilities. They do not write the future.
Reading the supply numbers correctly
Supply is the most-quoted and most-misread part of tokenomics. The "low market cap" framing on launch day is often misleading because it ignores how many tokens will eventually exist.
Circulating, total, and max supply
Circulating supply is the number of tokens currently liquid on the market. Total supply is the number of tokens that exist in any form, including locked allocations. Max supply is the maximum number of tokens that will ever exist, if the token has a hard cap. Some tokens have all three numbers identical. Many do not, and the gap between circulating and max supply is where future dilution lives.
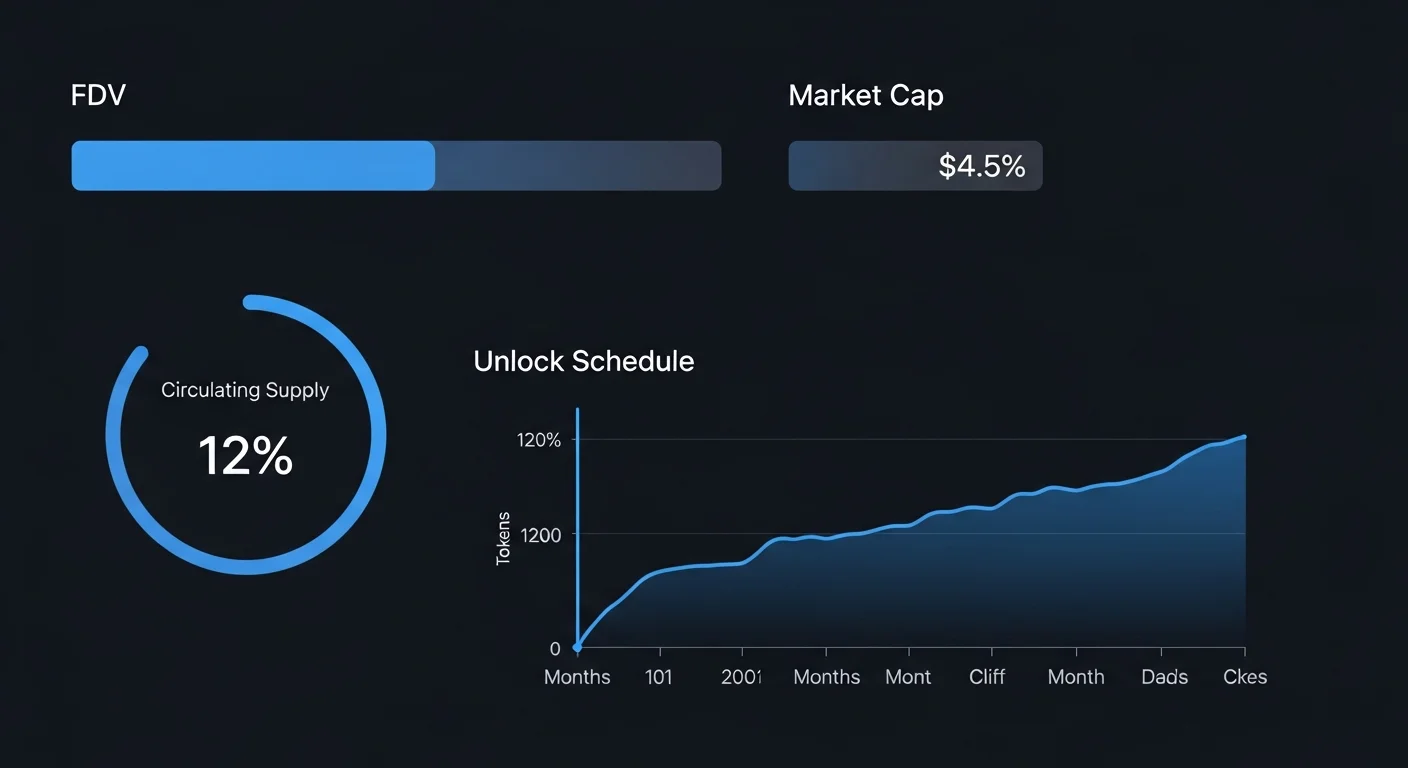
Market cap versus fully diluted valuation
Market cap multiplies circulating supply by price. Fully diluted valuation (FDV) multiplies max supply by price. A token can show a "small" market cap and a much larger FDV if most of the supply is still locked. New tokens with a 5 percent circulating supply at launch and a 100 million FDV are not actually cheap. They are pricing in a future where 95 percent of tokens have not yet hit the market.
The honest read is to compare FDV with the project's revenue, traction, and competitor valuations. A token whose FDV implies it should be worth more than well-established protocols is making an aggressive claim, and the upside has already been priced in.
Inflationary, deflationary, and stable supply
Some tokens issue more units over time, often to reward stakers, validators, or liquidity providers. Some tokens reduce supply through burns or buybacks, which is sometimes called deflationary design. Some tokens have a fixed supply that never changes. None of these models are universally good or bad. They are tradeoffs. Inflationary supply can fund growth. Deflationary supply can support price. Fixed supply can simplify the long-term thesis. The question is whether the chosen model fits the protocol's actual behavior.
Distribution and why it matters more than headlines suggest
Distribution determines who holds the token, and therefore who can sell it. Two projects with identical supply curves can behave completely differently if their token is distributed differently across team, investors, treasury, community, and ecosystem.
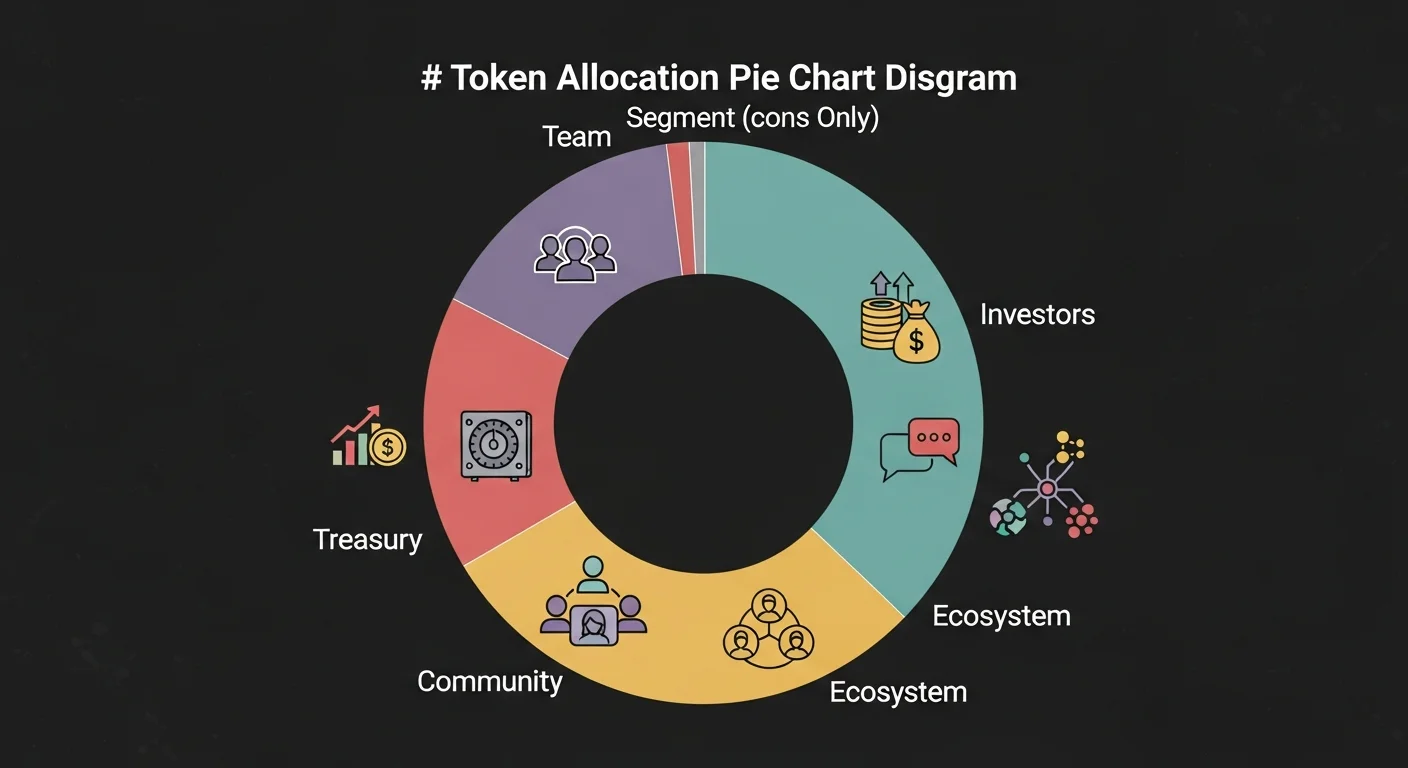
Common allocation buckets
Most projects break their token into a few standard buckets. Team and advisors typically receive a meaningful slice as compensation. Investors receive an allocation in exchange for early funding. Treasury covers ongoing operations. Community and ecosystem allocations fund users, partners, integrations, and incentives. Public sale or fair launch allocations cover whatever is sold or distributed openly.
The healthy ratios depend on the project type. A protocol with heavy ongoing development costs needs a meaningful treasury. A project that prides itself on community ownership often emphasizes community allocations. The danger sign is when team and investor allocations dominate the supply with light vesting and weak community alignment.
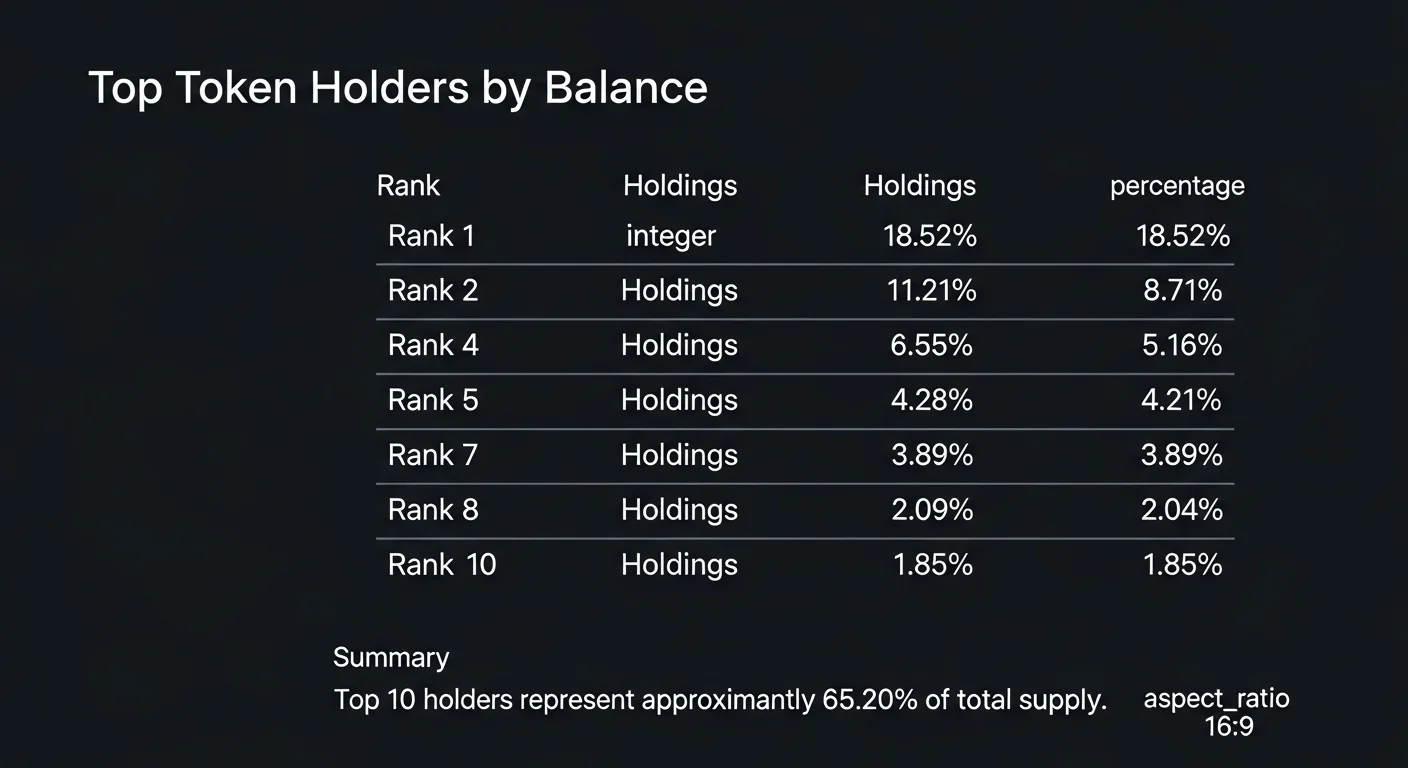
Holder concentration
On-chain holder concentration is a powerful but underused signal. If the top ten wallets hold 80 percent of the circulating supply, the price chart is one decision away from a sudden, severe drawdown. If the top ten wallets hold 10 percent of supply with the rest spread across thousands of addresses, the market is much harder to walk down with a single sell program. Tools like DEXTools and on-chain explorers let any reader pull this data in seconds.
Insider versus community allocation
Compare the percentage allocated to insiders (team plus investors) with the percentage allocated to community-facing buckets. Insider-heavy designs tend to underperform after major unlocks. Community-heavy designs tend to be more resilient to large unlock events because the float is broader. Neither shape is inherently bad, but the difference matters a lot for short and medium-term price behavior.
Vesting and emissions, the two clocks every holder should watch
Vesting and emissions decide when supply hits the market. They are the most common reason "good projects" still bleed for months. The product can ship, the partnerships can land, and the chart can still grind down because the supply curve is gradually transferring tokens from locked allocations to liquid wallets.
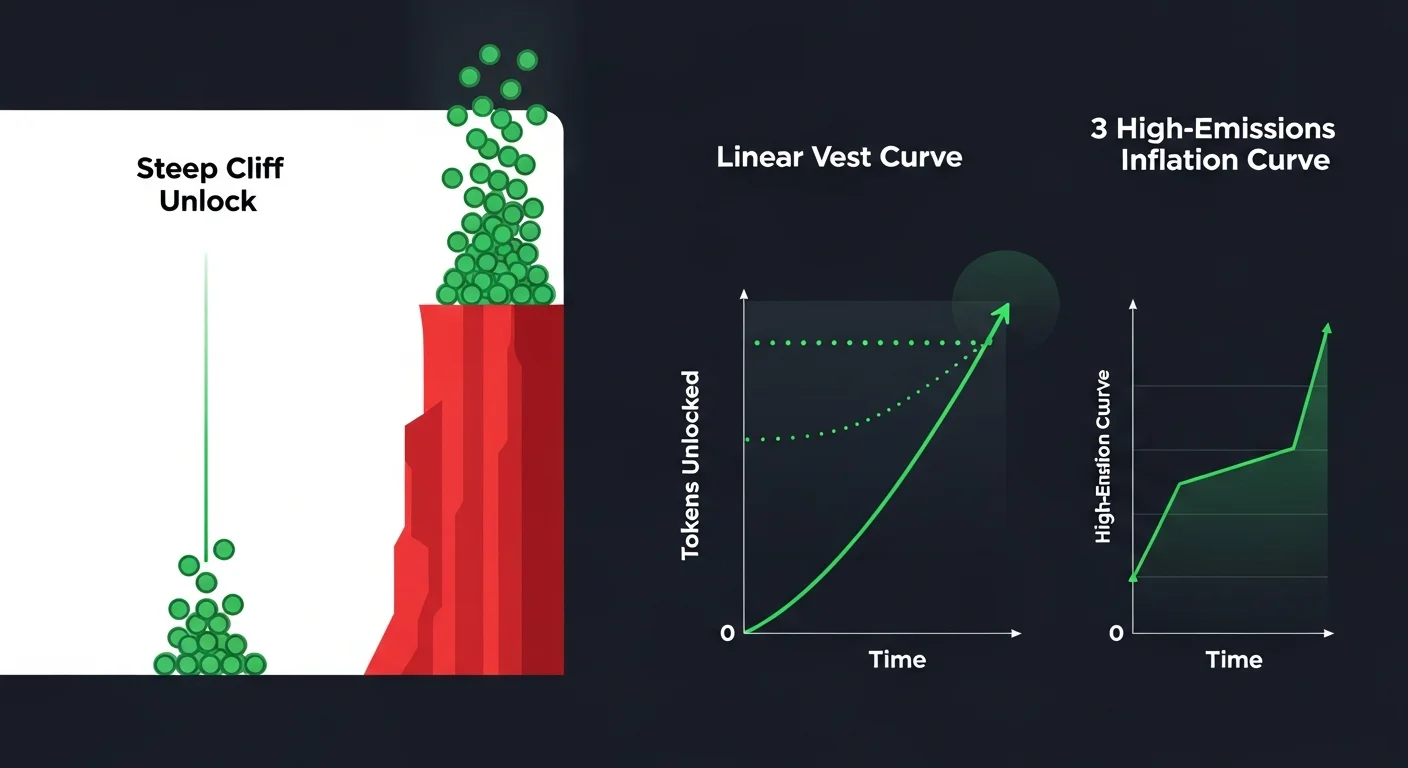
Cliff unlocks vs linear vesting
A cliff unlock releases a large slug of tokens at once after an initial lockup period. A linear vesting schedule releases tokens gradually over time. Cliff unlocks are dangerous because they create concentrated selling pressure on a single date that anyone can mark on a calendar. Linear vesting spreads selling across many smaller decisions, which is usually less destructive.
Calendar dates that matter
Every serious tokenomics review includes the upcoming unlock calendar. Twelve-month and twenty-four-month unlock cliffs after launch are common. So are the staggered unlocks that follow them. A trader who knows that a major unlock is one month away will treat the same chart very differently from a trader who is unaware. Public dashboards now track these unlocks across hundreds of projects.
Emissions and dilution
Emissions are scheduled new tokens that enter circulation, often through staking rewards, validator rewards, or liquidity mining. Emissions can be healthy when they fund network security and bootstrap growth. They become destructive when the rate of new supply exceeds the rate of new demand. A "20 percent staking APY" funded entirely by emissions is just nominal yield. Real yield comes from fees and revenue, not from printing more tokens for the same holders.
Token utility and the value-capture problem
The hardest part of tokenomics is making sure the token actually does something inside its ecosystem. A protocol can be useful, profitable, and growing, and the native token can still underperform if it has no real value-capture mechanism.
Real utility versus narrative utility
Real utility means the token is required to do something inside the protocol. Examples include paying for transactions, securing the network through staking, providing collateral, or participating in governance with meaningful authority. Narrative utility is when a token is described as "powering" an ecosystem without any clear mechanism that forces actual demand. The chart eventually tells the difference.
Governance, staking, and fee accrual
Governance gives token holders voting rights over protocol decisions. Staking creates demand by rewarding holders who lock tokens to secure or operate the system. Fee accrual sends a portion of protocol revenue to token holders, either through buybacks, burns, or direct distributions. Each of these mechanisms creates real demand. Each can also be implemented poorly, with weak governance, low staking yields, or fees that bypass the token entirely.
Burns, buybacks, and value capture in 2026
Burns reduce supply, often as a function of fees collected. Buybacks use protocol revenue to repurchase tokens from the market, sometimes redistributing them to stakers and sometimes burning them. In 2026, the more sustainable designs lean on real revenue rather than headline burns funded by inflation. A buyback funded by genuine fees is a much stronger value-capture signal than a burn that just retires tokens that were always going to be unused.
A practical evaluation framework
The same evaluation framework works for blue-chip tokens, mid-cap tokens, and brand-new launches. The questions are simple. The honest answers are what most readers skip.
- What is the FDV vs the current market cap? If most supply is still locked, the price you see is not the price you are paying long term.
- Who holds the supply? Pull up the top wallets and the team and investor allocations.
- When do unlocks happen? Map the next twelve months of cliff unlocks and linear vesting events.
- Where does the demand come from? Identify the real value-capture mechanism, not the marketing copy.
- How fast is supply growing? Compare emissions and dilution rates with realistic adoption growth.
If even three of those answers point in a worrying direction, the trade is much worse than the chart suggests. If most of them point in a constructive direction, the project is at least playing on a fair table.
Practical workflow for DEXTools and on-chain users
Reading tokenomics is not a research project. Most of it can be done in a focused fifteen minutes if the data is available.
- Pull the supply data. Compare circulating, total, and max supply, and compute FDV.
- Open the holder distribution. Use DEXTools and on-chain explorers to check concentration.
- Find the unlock schedule. Public dashboards or the project's own documentation usually publish them.
- Read the actual utility. Confirm the token is required for something the protocol does, not just associated with it.
If you also want to dive deeper into surrounding skills, hand readers to fundamental analysis, fair launches, or airdrop farmers vs real users instead of forcing every related concept into this article.
Strong vs weak tokenomics in one short comparison
| Design quality | Typical features | Main risk |
|---|---|---|
| Strong | Balanced allocations, gradual vesting, real utility, fee-driven value capture | Slower price action while organic demand catches up |
| Weak | Insider-heavy, steep cliffs, narrative-only utility, inflation funded yields | Persistent dilution and underperformance even when the product works |
Frequently asked questions
What does tokenomics mean in crypto?
Tokenomics is the combined design of a token's supply, distribution, utility, vesting, and emissions. It defines how many tokens exist, who holds them, when they unlock, what they do, and how supply changes over time.
Why is tokenomics important?
Tokenomics shape long-term incentives. They determine whether holders, the team, and investors are aligned, or whether one group quietly drains value from the others through dilution and unlock pressure.
What is the difference between market cap and FDV?
Market cap multiplies circulating supply by price. FDV multiplies max supply by price. A small market cap with a huge FDV usually means most of the supply is still locked and waiting to enter the market.
How do I evaluate a token's vesting schedule?
Look for cliff unlocks, linear vesting periods, and the exact dates of major releases. Cliffs concentrate selling pressure on a single day. Linear schedules spread it out. Public unlock dashboards make this visible.
Are deflationary tokens always better than inflationary tokens?
No. Deflation is not magic. Inflation can fund real growth and security, while deflation funded by gimmicks does not capture any real value. The right model depends on the project's revenue, traction, and operational needs.
Final takeaway: Tokenomics is the structural side of crypto investing that quietly compounds for or against you. Read supply, distribution, utility, vesting, and emissions together, treat FDV like a real number, and let the design tell you whether the chart will have to fight gravity for the next year.
Disclaimer: This guide is for educational purposes only and does not constitute investment, financial, legal, or trading advice. Tokenomics analysis can improve context, but it does not remove risk.
Related Guides
- How to Evaluate Crypto Tokenomics: Vesting and Cliffs 2026
- TON Tokenomics: Toncoin Supply, Distribution and Inflation Explained (2026)
- Top 5 Token Unlock Trackers in 2026: Best Calendars and Alerts for Supply Events
- FDV vs Market Cap in Crypto: How to Read Unlock Risk Before You Buy (2026)
- What Is Cliff Vesting in Crypto? Unlock Timing and Price Risk (2026)
Frequently Asked Questions
What is tokenomics in crypto?
Tokenomics describes the economic design of a token, including its supply, distribution, emissions, and utility. Understanding it helps you judge how a token may be affected by incentives and future supply changes.
Why does token supply and distribution matter?
How tokens are split among the team, investors, and community affects who can sell and how concentrated ownership is. Heavy concentration in a few hands can create price and governance risks.
What are token unlocks and vesting?
Vesting schedules release allocated tokens to insiders or investors gradually over time, and an unlock is when a batch becomes transferable. Large unlocks can add selling pressure as new supply enters the market.
What is the difference between supply and emissions?
Supply refers to how many tokens exist or will ever exist, while emissions are the rate at which new tokens are created and released over time. High emissions can dilute existing holders if demand does not keep pace.