The First Red Day: What a Token’s First Major Selloff Reveals
— By Whatsertrade in Tutorials

Every trending token eventually faces its first serious selloff. The early chart may be full of green candles, rising volume, and social excitement. But the fir
Every trending token eventually faces its first serious selloff. The early chart may be full of green candles, rising volume, and social excitement. But the first red day is often the real test.
A token's first major selloff reveals how strong the market really is. It shows whether holders have conviction, whether buyers are waiting, whether liquidity can absorb selling, and whether the narrative survives pressure.
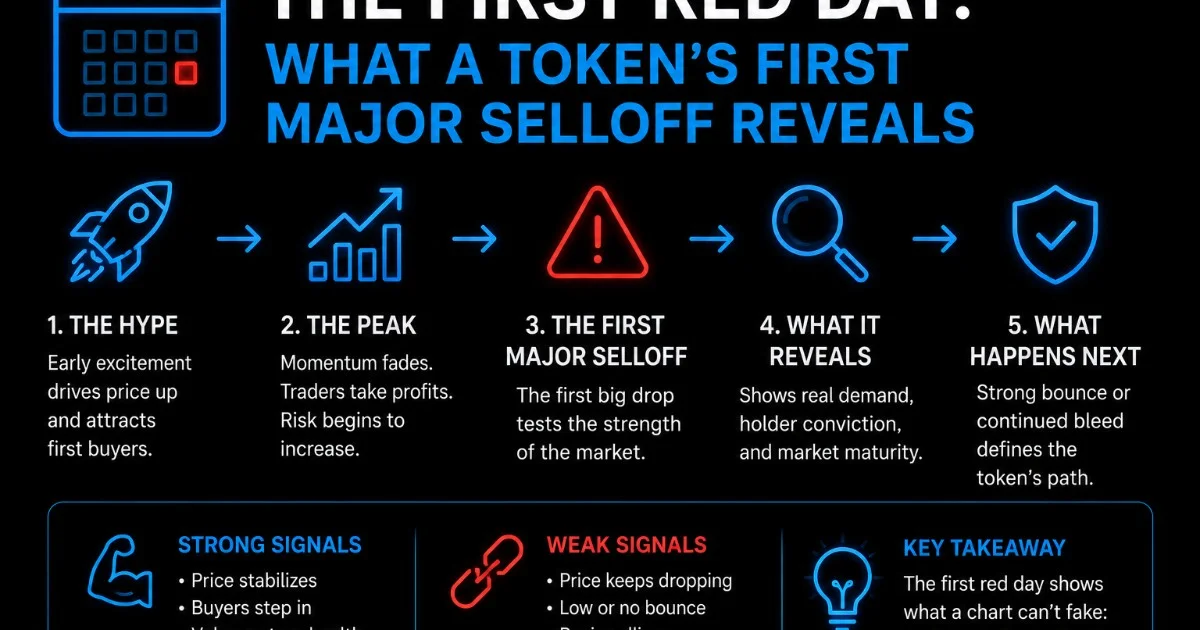
For traders, the first red day can be more informative than the first pump.
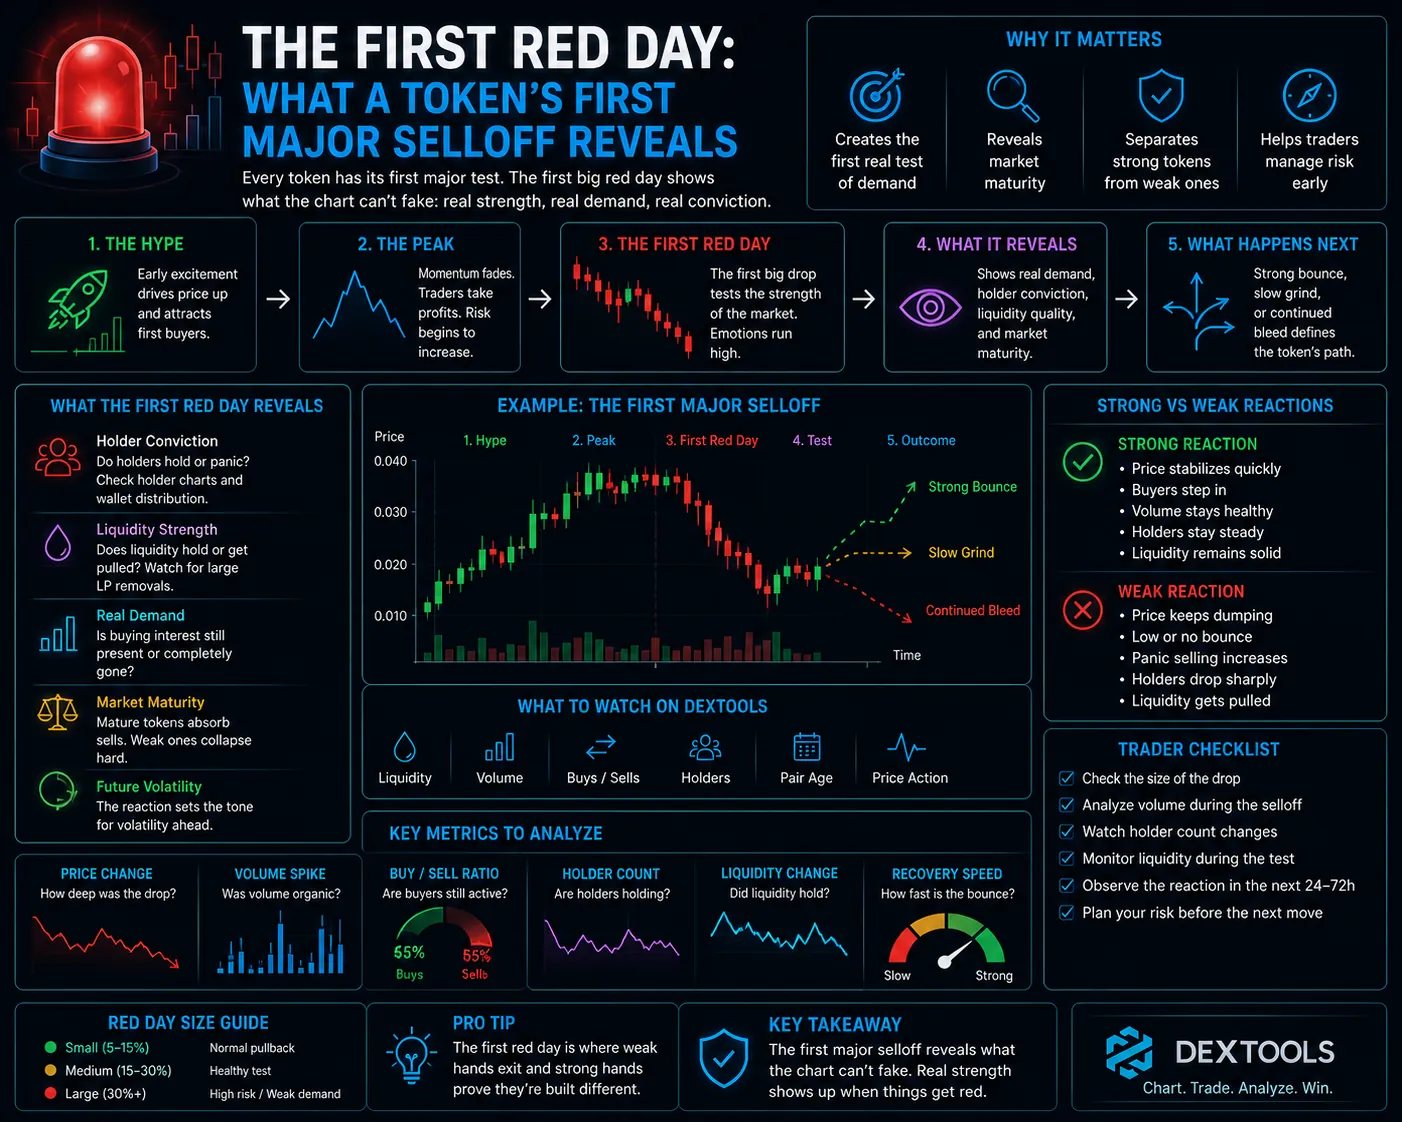
Why the First Red Day Matters
During the early hype phase, almost everything can look bullish. New buyers arrive, volume increases, and social attention grows. But this phase does not prove that the token has durable demand. It only proves that attention exists.
The first major red day changes the environment. Traders who bought early may take profit. Late buyers may panic. Whales may test liquidity. The community may become emotional. The chart begins to show whether the market has real support.
A strong token can survive a red day. A weak token may not recover.
Selloffs Reveal Holder Conviction
Holder conviction is difficult to measure during a pump. Everyone looks confident when price is rising. The selloff reveals who is willing to stay when the chart becomes uncomfortable.
If many holders sell immediately at the first sign of weakness, the token may be dominated by short term participants. If holders remain steady and buyers step in, the market may have stronger conviction.
This does not mean selling is always bad. Profit taking is normal. The key is whether selling becomes panic or remains orderly.
Liquidity During the First Selloff
Liquidity quality becomes clear during a red day. A pool may look healthy during rising price, but selling pressure tests whether liquidity can actually support the market.
If moderate sells cause extreme price impact, the pool may be weaker than it appeared. If liquidity remains stable and price finds a base, the market may be more resilient.
Traders should watch whether liquidity is removed during the selloff. Liquidity removal during weakness can increase fear and accelerate downside.
Volume Tells the Story
High red volume can mean different things. It may show panic selling, but it can also show strong absorption if buyers are taking the other side. The meaning depends on price reaction.
If volume is high and price collapses without recovery, sellers are in control. If volume is high but price stabilizes, buyers may be absorbing supply. If volume disappears completely after the selloff, attention may be fading.
DEXTools can help traders compare volume with price behavior and liquidity changes during the selloff.
The Recovery Attempt
The first bounce after a red day is important. A strong recovery can show that traders still believe in the token. A weak bounce can show that buyers are hesitant.
Traders should watch whether the bounce comes with real volume. A low volume bounce may be temporary. A bounce supported by strong transactions and stable liquidity is more meaningful.
The recovery attempt does not need to reclaim all losses immediately. What matters is whether the token shows signs of continued interest.
Social Reaction vs Market Reaction
Community reaction during the first red day can be revealing. Some communities remain organized, explain context, and continue building. Others become chaotic, defensive, or silent.
However, traders should not rely only on social sentiment. A loud community cannot replace market data. The best signal appears when community confidence is supported by liquidity, volume, and holder retention.
If social activity stays loud while market data weakens, caution is needed.
How to Analyze the First Red Day With DEXTools
Start by checking the size of the price drop. Then review volume, liquidity, and recent transactions. Watch whether the selloff came from many wallets or a few large sellers. Compare the red day to previous green days.
Next, study the recovery. Does the token attract buyers after the drop? Does liquidity stay in place? Does volume return? Are holders still increasing, or does the base begin to shrink?
The goal is not to predict perfectly. The goal is to understand whether the token passed its first stress test.
Conclusion
The first red day is one of the most important moments in a token's early market life. It reveals whether hype is supported by real demand, holder conviction, and liquidity strength.
DEXTools helps traders analyze this moment through price action, volume, liquidity, transactions, and market behavior. A token that survives its first major selloff may deserve continued attention. A token that breaks under pressure may have been weaker than the hype suggested.
Green candles attract traders. Red candles reveal the truth.
How to Bridge Crypto Between Chains: Complete Cross-Chain Tutorial 2026 How to Use 1inch for Swaps: Classic, Fusion and Limit Orders (2026) OKX Web3 Wallet Tutorial 2026: Multi-Chain Setup GuideFrequently Asked Questions
What is a token's first red day?
A token's first red day refers to its initial significant price drop following its launch or a period of growth. It often signifies increased selling pressure or a shift in market sentiment.
Why do tokens experience a first red day?
Tokens can experience a first red day due to various factors, including profit-taking by early investors, market-wide corrections, negative news, or the realization of overvaluation.
Is a first red day always a bad sign for a cryptocurrency?
Not necessarily. A first red day can be a natural part of a token's price discovery process. It can also present opportunities for new investors to enter at a lower price.
How do investors typically react to a token's first red day?
Reactions vary. Some investors may panic and sell, while others may see it as a buying opportunity or hold their positions, anticipating a recovery.
What can be learned from a token's first red day?
A token's first red day can reveal insights into its investor base, market resilience, and the effectiveness of its support levels. It can also indicate the level of speculative interest in the asset.
Related Guides
- Crypto Tax Guide 2026: How Every Major Country Taxes Cryptocurrency
- Crypto Bloodbath: ETH Falls to $2,200, XRP to $1.33 as Geopolitical Crisis Triggers Market-Wide Selloff
- What Is Day Trading in Crypto? 2026 Guide
- Swing Trading Crypto for Beginners: Multi-Day Setups and Risk Rules (2026)
- How to Day Trade Crypto: Complete Strategy and Risk Management Guide (2026)