What Is RSI Divergence in Crypto Trading? 2026 Guide
— By Tony Rabbit in Tutorials
Learn what RSI divergence is, how regular and hidden divergence work, and how crypto traders use it to spot weakening momentum and confirm trend shifts.
RSI divergence is one of the most discussed concepts in crypto technical analysis, and for good reason. It offers an early warning that the momentum behind a price move may be fading, often before the chart itself confirms a reversal. For traders trying to read volatile crypto markets, understanding this signal can mean the difference between holding into a top and stepping aside in time.
In this guide you will learn exactly what RSI divergence is, how the Relative Strength Index works, the difference between bullish and bearish divergence, and how hidden divergence points to trend continuation. We will also cover how to confirm these signals so you avoid acting on noise. None of this is financial advice, and nothing here predicts prices. It is a framework for understanding momentum.
What Is the RSI?
The RSI, or Relative Strength Index, is a momentum oscillator that measures the speed and magnitude of recent price changes. It moves on a scale between 0 and 100, and the most common setting is a 14 period lookback. Many traders treat readings above 70 as overbought and readings below 30 as oversold, although these levels are guidelines rather than automatic buy or sell triggers.
The key idea is that the RSI reflects momentum, not price itself. Price can keep climbing while the underlying momentum quietly slows down. That gap between what price is doing and what momentum is doing is the foundation of divergence.
What Is RSI Divergence?
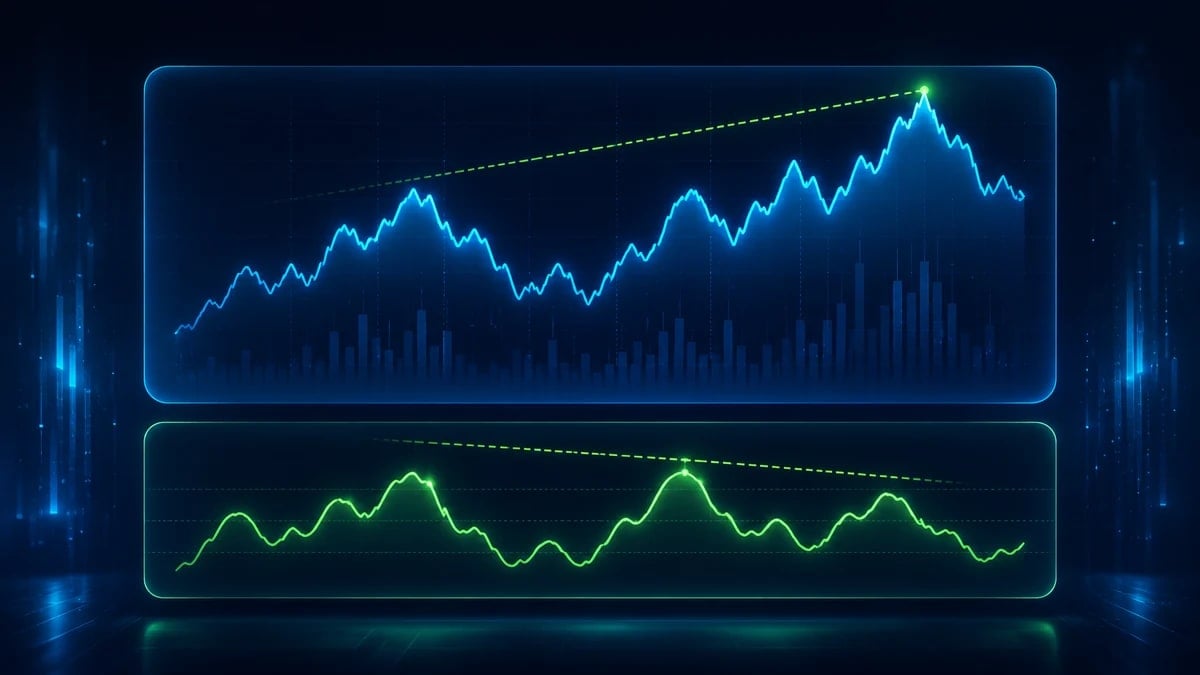
RSI divergence happens when price and the RSI move in opposite directions. Instead of confirming each other, the two diverge, hinting that the current move is running on weakening fuel. When price pushes to a new extreme but the RSI fails to follow, the indicator is telling you that fewer participants are driving the move with the same conviction as before.
Divergence comes in two broad families. Regular divergence warns that a trend may be losing steam and could reverse. Hidden divergence, by contrast, suggests that the existing trend is likely to continue after a pause. Knowing which type you are looking at is essential, because they point in opposite directions.

Regular Divergence: Bearish and Bullish
Regular divergence is the classic reversal warning. It shows up at the end of a trend, when momentum starts to disagree with price. There are two versions, and they sit on opposite sides of the market.
Bearish Regular Divergence
Bearish divergence appears during an uptrend. Price makes a higher high, but the RSI makes a lower high. In plain terms, the asset reached a new peak while the momentum behind that peak was weaker than before. This warns that the uptrend may be losing steam and that buyers are becoming exhausted. It does not guarantee a top, but it is a signal to pay closer attention and tighten your risk management.
Bullish Regular Divergence
Bullish divergence is the mirror image and shows up during a downtrend. Price makes a lower low, but the RSI makes a higher low. The new low came with less downside momentum than the previous one, hinting that the downtrend may be exhausting and that selling pressure is fading. Again, this is a clue, not a confirmed bottom.
Hidden Divergence: A Continuation Signal
Hidden divergence is less talked about but extremely useful, because it points toward trend continuation rather than reversal. It typically forms during a pullback inside an existing trend and suggests the trend is ready to resume.
Hidden bullish divergence occurs in an uptrend when price makes a higher low while the RSI makes a lower low. The shallow pullback in price combined with a deeper dip in momentum suggests the uptrend remains intact. Hidden bearish divergence occurs in a downtrend when price makes a lower high while the RSI makes a higher high, hinting that the downtrend is likely to continue. Traders often use hidden divergence to time entries in the direction of the prevailing trend.
How to Confirm RSI Divergence
The single most important thing to remember is that divergence is a warning, not a precise timing tool. Momentum can diverge from price for a long time while the trend keeps running, which is why many traders who short into bearish divergence too early get squeezed. Patience and confirmation are what separate a useful signal from a costly guess.
Before acting on divergence, wait for confirmation. A few practical approaches help filter out weak signals:
- Wait for a break of structure, such as price closing below a recent swing low after bearish divergence or above a recent swing high after bullish divergence.
- Look for a candlestick signal at the divergence point, like an engulfing candle or a clear rejection wick.
- Combine divergence with support and resistance, since a bearish divergence into a major resistance zone carries more weight than one in the middle of nowhere.
- Check higher timeframes, because divergence on a daily chart generally matters more than divergence on a one minute chart.
When you study tokens across decentralized exchanges, charting tools on platforms such as DEXTools let you overlay the RSI on price action so you can spot these momentum gaps directly on the assets you are watching.
Common Mistakes Traders Make
The most frequent error is treating divergence as an automatic entry. A lower RSI high during a strong uptrend is not a sell button, it is a flag. Another mistake is hunting for divergence on very low timeframes, where noise produces dozens of false signals. Lower timeframes generate more divergences, but the majority lead nowhere.
Traders also tend to ignore the trend context. Regular divergence works best when a trend is mature and extended, not when it has barely begun. And finally, many people forget about hidden divergence entirely, which means they fight the trend instead of trading with it. Always ask whether you are looking at a reversal setup or a continuation setup before you act.
Putting It Together
A sensible workflow is to first identify the dominant trend, then scan for divergence that fits the context. In an uptrend, hidden bullish divergence supports staying long, while bearish regular divergence near resistance warns of a possible top. In a downtrend, hidden bearish divergence supports the bias lower, while bullish regular divergence near support hints at exhaustion.
Once you spot a qualifying divergence, you wait. You let price confirm with a structure break or a candlestick signal, you check that the level lines up with meaningful support or resistance, and only then do you plan an entry with a defined invalidation point. The divergence gives you the heads up, the confirmation gives you the trigger, and your risk management gives you survival.
Conclusion
RSI divergence is a powerful lens for reading momentum in crypto markets. Regular divergence warns that a trend may be weakening and could reverse, while hidden divergence suggests the trend is likely to continue. The RSI itself simply measures the strength behind price moves, and divergence highlights the moments when price and momentum stop agreeing.
Treat it as a warning rather than a guarantee. Pair it with support and resistance, wait for confirmation through a break of structure or a candlestick signal, and respect the fact that divergence can persist far longer than seems reasonable. Used with discipline, it becomes one more reliable tool in a well rounded technical analysis toolkit. As always, this is educational content and not financial advice.
Beyond the Basics: Contextualizing RSI Divergence in Volatile Markets
While understanding the mechanics of RSI divergence is crucial, its true power in crypto trading lies in its contextual application. A standalone divergence signal, especially in a highly volatile or low liquidity asset, can often be a false flag. The crypto market's propensity for rapid, sentiment-driven swings means that even strong technical signals need corroboration. Traders must avoid the trap of isolating RSI divergence as the sole arbiter of a trade decision, instead viewing it as a powerful piece of a larger puzzle.
Consider the asset's overall market capitalization and trading volume. A large cap coin with consistent volume will likely exhibit more reliable divergence signals than a micro-cap altcoin prone to pump and dump schemes. Furthermore, the timeframe you are analyzing is critical. A bearish divergence on a 15-minute chart might only indicate a minor pullback, whereas the same signal on a daily or weekly chart could foreshadow a significant trend reversal. Always align your analysis with your trading strategy's intended holding period.
Integrating RSI Divergence with Broader Technical Analysis
- Always combine RSI divergence with price action analysis. Look for candlestick patterns that confirm the potential reversal or continuation implied by the divergence.
- Utilize support and resistance levels. A bearish divergence appearing near a strong resistance zone, or a bullish divergence at a key support level, significantly enhances the signal's validity.
- Incorporate moving averages. A divergence signal that appears as price crosses a critical moving average, such as the 50-day or 200-day MA, adds another layer of confirmation.
- Consider volume trends. Divergence accompanied by declining volume in the direction of the prior trend often strengthens the reversal signal.
- Be mindful of market structure. Is the asset in a clear uptrend, downtrend, or range-bound? Divergence signals behave differently in each scenario.
- Avoid over-trading. Not every divergence signal is actionable. Focus on high-probability setups that align with multiple confirming indicators.
Related Guides
- How to Use RSI in Crypto Trading: Strategy 2026
- What Is RSI in Crypto? Beginner Guide to the Index
- What Is Wash Trading in Crypto? Beginner Guide (2026)
- Wash Trading in Crypto: Red Flags Explained
- What Is Trading Volume in Crypto? How to Read It (2026)
Frequently Asked Questions
What is RSI divergence?
RSI divergence occurs when price and the Relative Strength Index move in different directions. It can signal that the momentum behind a price move is weakening.
What is the difference between regular and hidden divergence?
Regular divergence often warns of a potential trend reversal, for example price making a higher high while RSI makes a lower high. Hidden divergence is usually read as a trend continuation signal instead.
How do traders use RSI divergence?
Traders use it to spot weakening momentum and to look for possible reversals or continuations. It is generally combined with confirmation from price action or other indicators rather than used alone.
Is RSI divergence always reliable?
No, divergence can persist for a long time before price reacts, and it can produce false signals. It is best treated as one input among several in a trading decision.