What Is a Shooting Star Candlestick in Crypto Trading? 2026 Guide
— By Tony Rabbit in Tutorials
Learn how to spot and trade the shooting star candlestick, a bearish reversal pattern that warns of weakening momentum at the top of a crypto uptrend.
Candlestick patterns are one of the most popular tools for reading crypto price action, and few are as visually distinctive as the shooting star. With its small body sitting near the bottom of the candle and a long wick stretching upward, this pattern stands out on any chart and often appears right when a rally starts to run out of steam. For traders who learn to read it correctly, the shooting star can be an early warning that buyers are losing control.
In this 2026 guide, we break down exactly what a shooting star candlestick is, how it forms, what it signals about market psychology, and how crypto traders use it alongside context and confirmation. We also cover the patterns it is often confused with, common mistakes, and practical tips for using it responsibly. This is educational content only and not financial advice.
What Is a Shooting Star Candlestick?
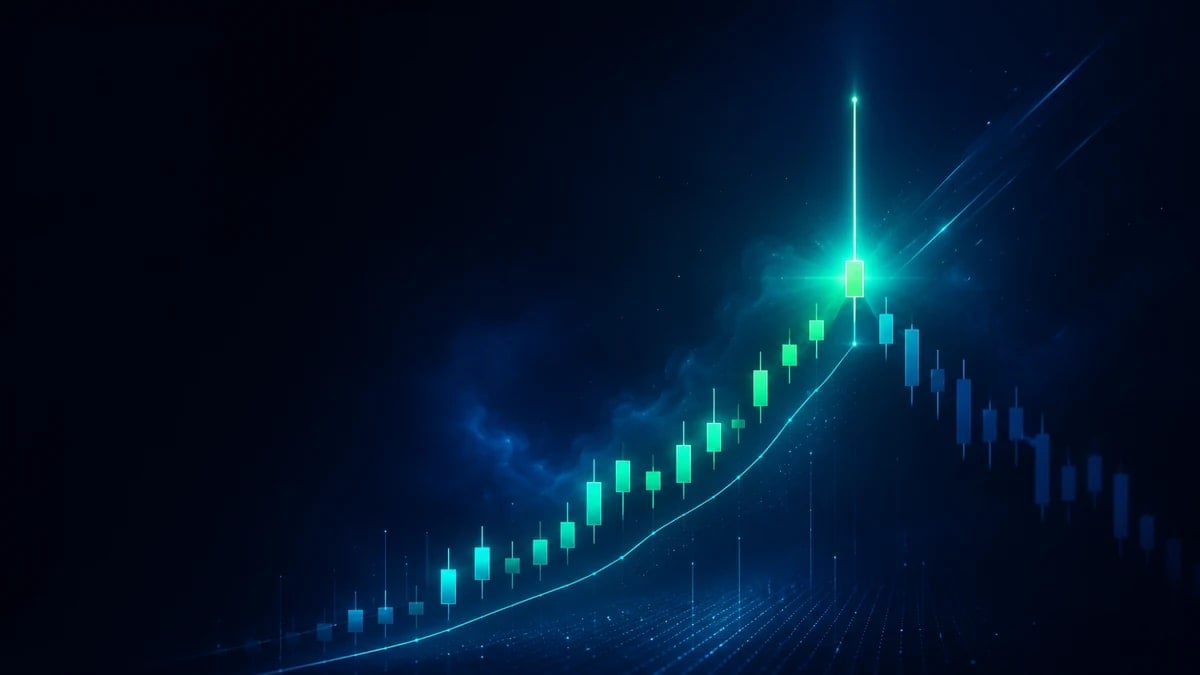
A shooting star is a bearish reversal candlestick that forms at the top of an uptrend. It is defined by three features: a small real body located near the low of the candle, a long upper wick that is at least twice the length of the body, and little or no lower wick. The result is a candle that looks like a tiny block balanced under a tall vertical line, resembling a star falling from the sky.
The shape matters because it captures a clear shift in control. The body color (green or red) is less important than the structure, although a red body that closes below the open is generally considered a stronger signal. What traders care about most is the long upper shadow and the close that sits far below the high.
How a Shooting Star Forms
To understand the pattern, it helps to walk through the session that creates it. After a sustained move higher, the candle opens and buyers continue their push, driving the price up to a new intraday high. This is where the long upper wick begins to form. As the session progresses, sellers step in and reject those higher prices, dragging the price back down toward the open.
By the time the candle closes, most or all of the gains have been erased, leaving a small body near the bottom and a long wick above it. That long shadow is the footprint of failed buying pressure. The market tried to go higher, attracted sellers at the highs, and gave back the advance before the close.
The Market Psychology Behind It
Every candlestick tells a story about the tug of war between buyers and sellers. A shooting star shows that bullish enthusiasm met strong resistance. Buyers were confident enough to lift the price early, but sellers proved more determined, absorbing the demand and forcing a reversal within the same period. When this happens after an extended rally, it suggests that the trend may be exhausted and that momentum is fading.
What the Shooting Star Signals
The core message of a shooting star is weakening bullish momentum. It does not guarantee that the price will drop, but it flags that the balance of power may be shifting from buyers to sellers. The pattern is most meaningful when it appears after a clear uptrend, ideally near a known resistance level or a previous swing high where sellers are likely to defend.
Context is everything. A shooting star in the middle of a sideways range carries far less weight than one that prints at the top of a strong, multi-day advance. The longer the preceding uptrend and the more obvious the resistance, the more attention the pattern deserves. On its own, however, it is only one piece of evidence and should never be treated as a complete trading system.
Confirmation and Volume
Experienced traders rarely act on a shooting star the moment it closes. Instead, they wait for confirmation. The most common form of confirmation is the next candle closing lower than the shooting star, which suggests that sellers have followed through and the rejection was not a one-off spike. Without that follow-up, the pattern can fail and the uptrend can resume.
Volume adds another layer of insight. A shooting star that forms on higher than average volume indicates that many participants were involved in the rejection, giving the signal more credibility. Light volume, by contrast, may mean the move lacks conviction. Combining the pattern with rising volume on the down move strengthens the case for a potential reversal.
Shooting Star vs Similar Patterns
The shooting star is easy to mix up with a few lookalike candles, so it is worth knowing the differences clearly.
Inverted Hammer
The inverted hammer is the mirror image of the shooting star in terms of meaning. It shares the same shape, a small body with a long upper wick, but it appears at the bottom of a downtrend rather than the top of an uptrend. Because of its location, the inverted hammer is treated as a potential bullish reversal signal, while the shooting star is bearish. The candle structure is nearly identical, so the surrounding trend is what tells them apart.
Hanging Man
The hanging man also forms at the top of an uptrend and warns of a possible reversal, but its shape is different. The hanging man has a small body with a long lower wick instead of a long upper wick. Both patterns appear at tops and both are bearish, yet the shooting star reflects rejection from above while the hanging man reflects intrasession selling that recovered before the close.
How Traders Use the Shooting Star
When a shooting star appears at the top of an uptrend and is confirmed by the following candle, some traders treat it as a cue to reduce long exposure, tighten risk management, or look for short setups in line with their strategy. A common approach is to place a stop-loss just above the high of the shooting star, since a move back above that level would invalidate the bearish signal.
Many traders combine the pattern with other tools to filter out weak signals. Resistance zones, trendlines, moving averages, and momentum indicators such as the RSI can all help confirm whether the broader picture supports a reversal. Charting platforms and analytics tools like DEXTools make it easier to scan multiple tokens and timeframes for these setups while checking liquidity and volume at the same time. The goal is to build a confluence of evidence rather than relying on a single candle.
Common Mistakes to Avoid
The most frequent error is trading the shooting star in isolation, without a prior uptrend or any nearby resistance. A long upper wick that is not preceded by a rally is not a true shooting star in the meaningful sense, because there is no bullish trend for it to reverse.
Another mistake is skipping confirmation and entering on the pattern alone. Crypto markets are volatile, and isolated wicks happen often, especially on lower timeframes where noise is high. Ignoring volume, ignoring the higher timeframe trend, and placing stops too tightly are other pitfalls that can turn a reasonable idea into a losing trade. Patience and context consistently separate disciplined use of the pattern from impulsive guessing.
Conclusion
The shooting star candlestick is a clear, easy to recognize bearish reversal signal that warns of fading momentum at the top of an uptrend. Its long upper wick and small body near the low tell a story of buyers being overpowered by sellers within a single session. Used with proper context, confirmation from the next candle, and supporting volume, it can help traders anticipate potential turning points and manage risk more effectively. Like all candlestick patterns, it works best as one input among many rather than a standalone system, so always combine it with sound analysis and disciplined risk management. This article is educational and does not constitute financial advice.
Beyond the Textbook: The Shooting Star in High-Volatility Crypto Contexts
While the textbook definition of a shooting star candlestick holds true across markets, its interpretation in the hyper-volatile crypto landscape demands a nuanced approach. The sheer speed and magnitude of price swings in digital assets can sometimes create "false positives" or intensify the pattern's implications, making it crucial for traders to look beyond the basic visual cue and consider the broader market structure.
For instance, a shooting star appearing after a parabolic, unsustainable pump in a low-liquidity altcoin might signal an immediate and brutal correction, far more severe than what one might expect in a traditional equity market. Conversely, during periods of extreme market euphoria, a shooting star might only lead to a minor retracement before buyers step back in, pushing prices higher. It's not just about the pattern itself, but its psychological impact within a market driven by strong narratives and herd mentality.
Practical Considerations for Crypto Traders
- Volume Confirmation is Paramount: A shooting star with significantly higher selling volume than preceding candles adds substantial weight to its bearish signal. In crypto, "fakeouts" often lack this crucial volume backing.
- Timeframe Sensitivity: While valid on all timeframes, a shooting star on a daily or weekly chart carries far more significance and predictive power than one on a 5-minute chart, especially for swing traders.
- Context of Underlying Asset: Consider the specific cryptocurrency. A shooting star on Bitcoin or Ethereum might indicate a broader market shift, whereas on a smaller cap altcoin, it could simply be profit-taking from a few large holders.
- Proximity to Resistance: The pattern is strongest when it forms precisely at a significant resistance level, whether it's a previous high, a Fibonacci retracement level, or a trendline. This confluence strengthens the reversal signal.
- Follow-Through Candle: Always wait for the subsequent candle to confirm the bearish reversal. A strong red candle closing below the shooting star's low provides much stronger validation than simply seeing the pattern itself.
Related Guides
- What Is an Evening Star Pattern in Crypto Trading? 2026 Guide
- What Is a Morning Star Pattern in Crypto Trading? 2026 Guide
- What Is a Spinning Top Candlestick in Crypto Trading? 2026 Guide
- What Is a Harami Candlestick Pattern in Crypto Trading? 2026 Guide
- What Is a Hanging Man Candlestick in Crypto Trading? 2026 Guide
- What Is a Bullish Engulfing Candlestick in Crypto Trading? 2
- What Is a Hammer Candlestick in Crypto? Trading Guide 2026
Frequently Asked Questions
What is a shooting star candlestick?
A shooting star is a single candle with a small body near the low and a long upper wick, appearing after an uptrend. It is read as a possible bearish reversal that shows buyers lost control after pushing price higher.
What does the long upper wick of a shooting star mean?
The long upper wick shows that price rose during the period but sellers pushed it back down before the close. This rejection of higher prices is what gives the pattern its bearish meaning.
How do traders confirm a shooting star?
Many traders wait for the next candle to close lower as confirmation, and some look for higher volume or resistance nearby. Confirmation helps avoid acting on a single candle that may not lead to a reversal.
Where does a shooting star carry the most meaning?
The pattern is most significant when it forms at the top of an uptrend or near a known resistance level. In the middle of a range it carries far less weight.