Trade Trending Tokens: Strategies & Risk Checks
— By Whatsertrade in Tutorials

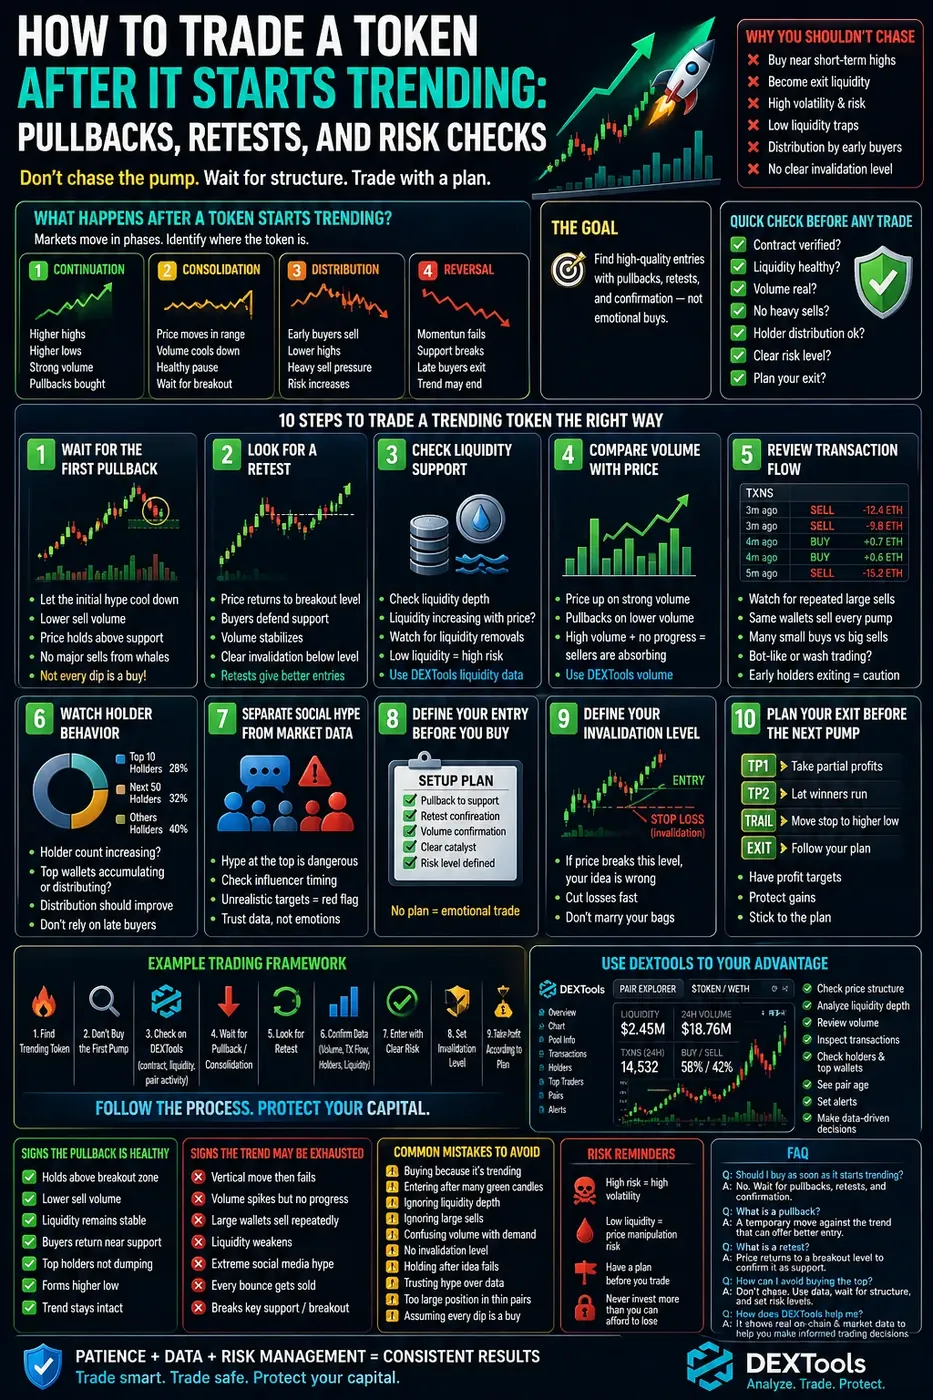
Learn to trade trending tokens wisely. Analyze charts with pullback strategies, liquidity checks, and setup-defined entries to mitigate risks.
A token starts trending. Volume rises, the chart moves fast, social media gets loud, and traders begin talking about the next big opportunity. This is where many DeFi traders make the same mistake: they buy the first green candle they see, not focusing on how to trade a trending token effectively.
Trending activity can create opportunity, but it can also create dangerous entries. The better question is not only whether a token is trending, but how to trade it after the trend has already started. Understanding trending token pullback strategies becomes crucial.
This guide focuses on the next step: how to wait for pullbacks, retests, and confirmation instead of chasing a vertical move. You will learn how to use DEXTools to review liquidity, volume, transactions, holder behavior, and price structure before entering a trending token.
The Dangers of Chasing Trending Tokens
A trending token has attention, but attention does not always mean a safe entry. By the time a token appears on trending lists or spreads across social media, early traders may already be in profit.
Chasing can expose you to buying near short-term highs, becoming exit liquidity for early buyers, entering during unstable volatility, ignoring liquidity limitations, missing signs of distribution, and trading without an invalidation level. Trending token pullback strategies can mitigate these risks.
The goal is not to avoid every trending token. The goal is to avoid entering without structure.
Phases After a Token Trends
Understanding Market Reactions
After a token starts trending, it usually enters one of several phases: continuation, consolidation, distribution, or reversal.
In continuation, price keeps making higher highs and higher lows. Volume remains strong, liquidity supports the move, and pullbacks are bought quickly.
In consolidation, price stops moving vertically and begins trading in a range. This can be healthy if volume cools down without a major breakdown.
Identifying Distribution or Reversal
In distribution, early buyers sell into new demand. The chart may still look active, but every pump meets strong selling pressure.
In reversal, momentum fails, support breaks, and late buyers begin exiting. Liquidity may thin out and social hype may fade quickly.
Your job is to identify which phase is developing before you enter.
Strategies for Pullbacks and Retests
Step 1: Wait for the First Pullback
A pullback is a move against the current trend. In a strong uptrend, it gives traders a chance to evaluate whether buyers are still interested after the initial spike.
A healthy pullback may show price cooling without a full collapse, lower selling volume than buying volume, buyers stepping in near previous support, liquidity staying stable, no major sells from top holders, and the token holding above the breakout area.
A dangerous pullback may show sharp selling immediately after the pump, large wallets exiting, volume disappearing, liquidity dropping, price losing the entire breakout, and social media becoming defensive or aggressive.
Not all dips are buying opportunities, some dips signify the start of an exit.
Step 2: Look for a Retest
A retest happens when price returns to a previous breakout level and checks whether that level can act as support.
For example, if a token breaks above a resistance zone and later pulls back to that same area, traders watch to see if buyers defend it. If they do, the retest may confirm strength. If they do not, the breakout may fail.
A useful retest often includes price holding a previous resistance area, buyers returning near the level, volume stabilizing, no panic selling, and a clear invalidation point below support.
Retests are useful because they can give you a more defined risk level than buying during a vertical candle.
Ensuring Liquidity Supports the Move
Step 3: Check Liquidity
Liquidity is critical when trading trending tokens. A token can look strong on the chart but still be risky if liquidity is too thin.
Use DEXTools to check current liquidity, liquidity changes during the trend, whether liquidity increased with price, price impact for realistic trade sizes, whether liquidity was removed during the pump, and whether one wallet controls too much of the pool.
A strong trend with growing liquidity is generally healthier than a strong trend with weak liquidity. If market cap rises quickly but liquidity stays low, downside can be violent.
Analyzing Volume for Insights
Step 4: Compare Volume
Volume helps you understand participation. However, volume alone is not bullish. You need to compare volume with price behavior.
Ask whether volume increased before or after the breakout, whether price is rising on strong volume, whether pullbacks happen on lower volume, whether sells are becoming larger than buys, whether volume is fading while price tries to push higher, and whether high volume is failing to move price up.
High volume with no price progress can be a warning sign, as it may mean sellers are absorbing demand.
Reading Transaction Flow & Holder Behavior
Step 5: Review Transaction Flow
The transaction feed can reveal what is happening beneath the chart. A trending token may attract many small buyers while a few large wallets sell into them.
Look for repeated large sells, the same wallets selling every bounce, many small buys followed by large sells, bot-like transaction patterns, sudden sell pressure after social posts, fresh wallets buying at the top, and failed attempts to push price higher.
If the transaction flow shows early holders exiting, wait. The trend may still continue, but risk has increased.
Step 6: Watch Holder Behavior
Holder growth can be positive, but it needs context. A token may gain many new holders while top wallets reduce exposure.
Check whether holders are increasing naturally, whether top wallets are selling, whether early wallets are still holding, whether supply is becoming more distributed, whether new holders are replacing old holders at higher prices, and whether whale wallets are accumulating or distributing.
Healthy holder growth should not depend only on late buyers entering while early wallets exit.
Evaluating Social Hype vs. Market Data
Step 7: Separate Hype from Data
Social hype can support a trend, but it can also appear near local tops. Before entering, compare the social story with the data.
Be careful when influencers post after the token already pumped, every comment suggests it cannot go lower, price targets become unrealistic, risk discussions disappear, sellers are attacked as weak, urgency replaces analysis, or the same message appears across many accounts.
A strong trade should make sense even after you close social media.
Defining Entry and Exit Strategies
Step 8: Set Your Entry
Do not enter only because the token is trending. Define the setup first.
A structured entry may be based on a pullback into support, a successful retest, a higher low, liquidity improving, volume returning after consolidation, large sells slowing down, a clear catalyst, and a clear invalidation level.
If you cannot explain why you are entering, you are probably reacting.
Step 9: Set Invalidation Levels
An invalidation level is the price or condition that proves your trade idea is wrong. It helps you avoid holding a failed trade due to hope.
Examples of invalidation include price losing the retest level, liquidity dropping sharply, a top wallet selling aggressively, volume fading completely, the token failing to make a higher low, negative project news, or the contract or pair changing unexpectedly.
Your invalidation should be decided before entry, not after price moves against you.
Step 10: Plan Your Exit
Trending tokens can move quickly. If you wait until emotions are high, you may fail to take profit or cut risk.
Before buying, decide where you would take partial profit, what price would make the trade invalid, whether you are scalping or swing trading, how much size you can exit without major price impact, whether you will move stops after a higher low, and what data would make you hold longer.
A plan does not guarantee success, but it reduces emotional decisions.
Example Framework for Trading Trending Tokens
Find the trending token, do not buy the first vertical move, check contract, liquidity, and pair activity on DEXTools, wait for a pullback or consolidation, look for a retest of the breakout area, confirm transaction flow is not dominated by large sellers, check whether holders and liquidity remain healthy, enter only if the risk level is clear, set an invalidation level, and take profit according to the plan, not according to hype.
This framework helps you move from reactive trading to structured trading.
Signs of Healthy Pullbacks vs. Exhausted Trends
Signs of a Healthy Pullback
A pullback may be healthy if price holds above the breakout zone, selling volume is controlled, liquidity remains stable, buyers return near support, top holders are not dumping, social interest remains active but not euphoric, the chart forms a higher low, and the token does not lose the entire trend quickly.
Healthy pullbacks create structure, while unhealthy pullbacks destroy it.
Signs the Trend May Be Exhausted
A trend may be exhausted if price goes vertical and then fails to recover, volume spikes but price stops advancing, large wallets sell repeatedly, liquidity weakens, social media becomes extremely euphoric, every bounce gets sold, the token loses the breakout level, or the narrative depends only on price going up.
When multiple warning signs appear together, patience is usually better than chasing.
Using DEXTools Post-Trending Tokens
DEXTools can help you move beyond hype by reviewing real market behavior.
Use it to check price structure, liquidity, volume, transactions, pair age, and holder behavior. These signals help you decide whether the trend has strength or whether the setup is becoming too crowded.
Avoid Common Mistakes with Trending Tokens
Avoid buying because the token is on a trending list, entering after several vertical candles, ignoring liquidity depth, ignoring large sells, confusing volume with healthy demand, buying without an invalidation level, holding after the trade idea fails, trusting social hype over market data, taking too large a position in a thin pair, or assuming every pullback is a dip to buy.
A trending token can be a setup, but it is not a strategy by itself.
Trading a token after it starts trending requires patience. The best entry is rarely the most emotional one. Instead of chasing the first spike, wait for structure.
Use pullbacks, retests, liquidity checks, volume analysis, transaction flow, holder behavior, and social sentiment to decide whether the move still has strength. DEXTools can help you study these signals in real time.
The goal is not to catch every trending token. The goal is to enter only when the data, risk, and setup are clear.
Common FAQs
Should I buy a token as soon as it starts trending?
Not necessarily. Trending means attention is rising, but it does not guarantee a good entry. Wait for structure, liquidity confirmation, and a clear risk level.
What is a pullback in crypto trading?
A pullback is a temporary move against the current trend. In an uptrend, it can give traders a chance to evaluate whether buyers are still defending the move.
What is a retest?
A retest happens when price returns to a previous breakout level and checks whether that level can act as support.
How can I avoid buying the top of a trending token?
Avoid vertical candles, check liquidity, review transaction flow, watch holder behavior, and wait for a pullback or retest before entering.
How can DEXTools help with trending token analysis?
DEXTools can help you review price structure, liquidity, volume, transactions, holder behavior, pair age, and market activity before making a trade.
How to Bridge Crypto Between Chains: Complete Cross-Chain Tutorial 2026 How to Use 1inch: Complete DEX Aggregator Swap Tutorial (2026) How to Use OKX Web3 Wallet: Multi-Chain DeFi Hub Guide (2026)Frequently Asked Questions
What makes a crypto token 'trending'?
A crypto token often trends due to significant price movements, new technological developments, or increased social media discussion. High trading volume and market cap increases can also contribute to its trending status.
How can I identify trending crypto tokens?
Platforms like CoinMarketCap and CoinGecko offer sections for 'trending' or 'gainers' which highlight tokens with recent significant price increases. Social media analysis tools and crypto news outlets can also provide insights into popular tokens.
What are the risks of trading trending tokens?
Trading trending tokens carries high volatility risk, as prices can fluctuate rapidly. There is also the risk of 'pump and dump' schemes where artificial hype drives prices up before a sharp decline.
Are trending tokens always a good investment opportunity?
Not necessarily. While some trending tokens may offer quick gains, many experience short-lived pumps followed by significant corrections. Thorough research beyond the trend is crucial.
What strategies are common for trading trending tokens?
Common strategies include 'buy the dip' after a slight correction, 'momentum trading' to ride the upward trend, and 'scalping' for small, frequent gains. Risk management, like setting stop-loss orders, is often employed.
Related Guides
- How to Find Trending Crypto on DEXTools (2026)
- DEXTools Beginner Tutorial: Setup, Navigation and First Trade Checks (2026)
- How Stablecoins Keep Their Peg: Collateral Models, Depeg Risk and On-Chain Checks
- How to Use TokenSniffer: Contract Risk Checks and Honeypot Clues (2026)
- Yield Farming Strategies, APY Quality and Risk Management (2026)