How to Use Bubblemaps to Spot Token Manipulation (2026)
— By Tony Rabbit in Tutorials

Learn how to use Bubblemaps to visualize holders and spot manipulation, clusters and bundling. A step-by-step 2026 Bubblemaps tutorial.
Bubblemaps is a blockchain analytics tool designed to visualize token holder networks across multiple EVM chains, helping users detect potential token manipulation. It illuminates patterns like whale accumulation, token movements by deployers, and concentrated liquidity, which are often invisible on standard block explorers, aiding in identifying rug pulls and other fraudulent activities.
Rug pulls cost traders $2.8 billion in 2024 alone. Behind every collapse is a story: a whale quietly accumulating, a deployer moving tokens to new wallets, liquidity sitting in a single owner's control. These patterns are invisible on standard block explorers-but they light up on Bubblemaps.
This tutorial shows you how to read token holder networks like a pro, spot manipulation tactics before they strike, and combine Bubblemaps data with DEXTools for rock-solid due diligence.
What Is Bubblemaps
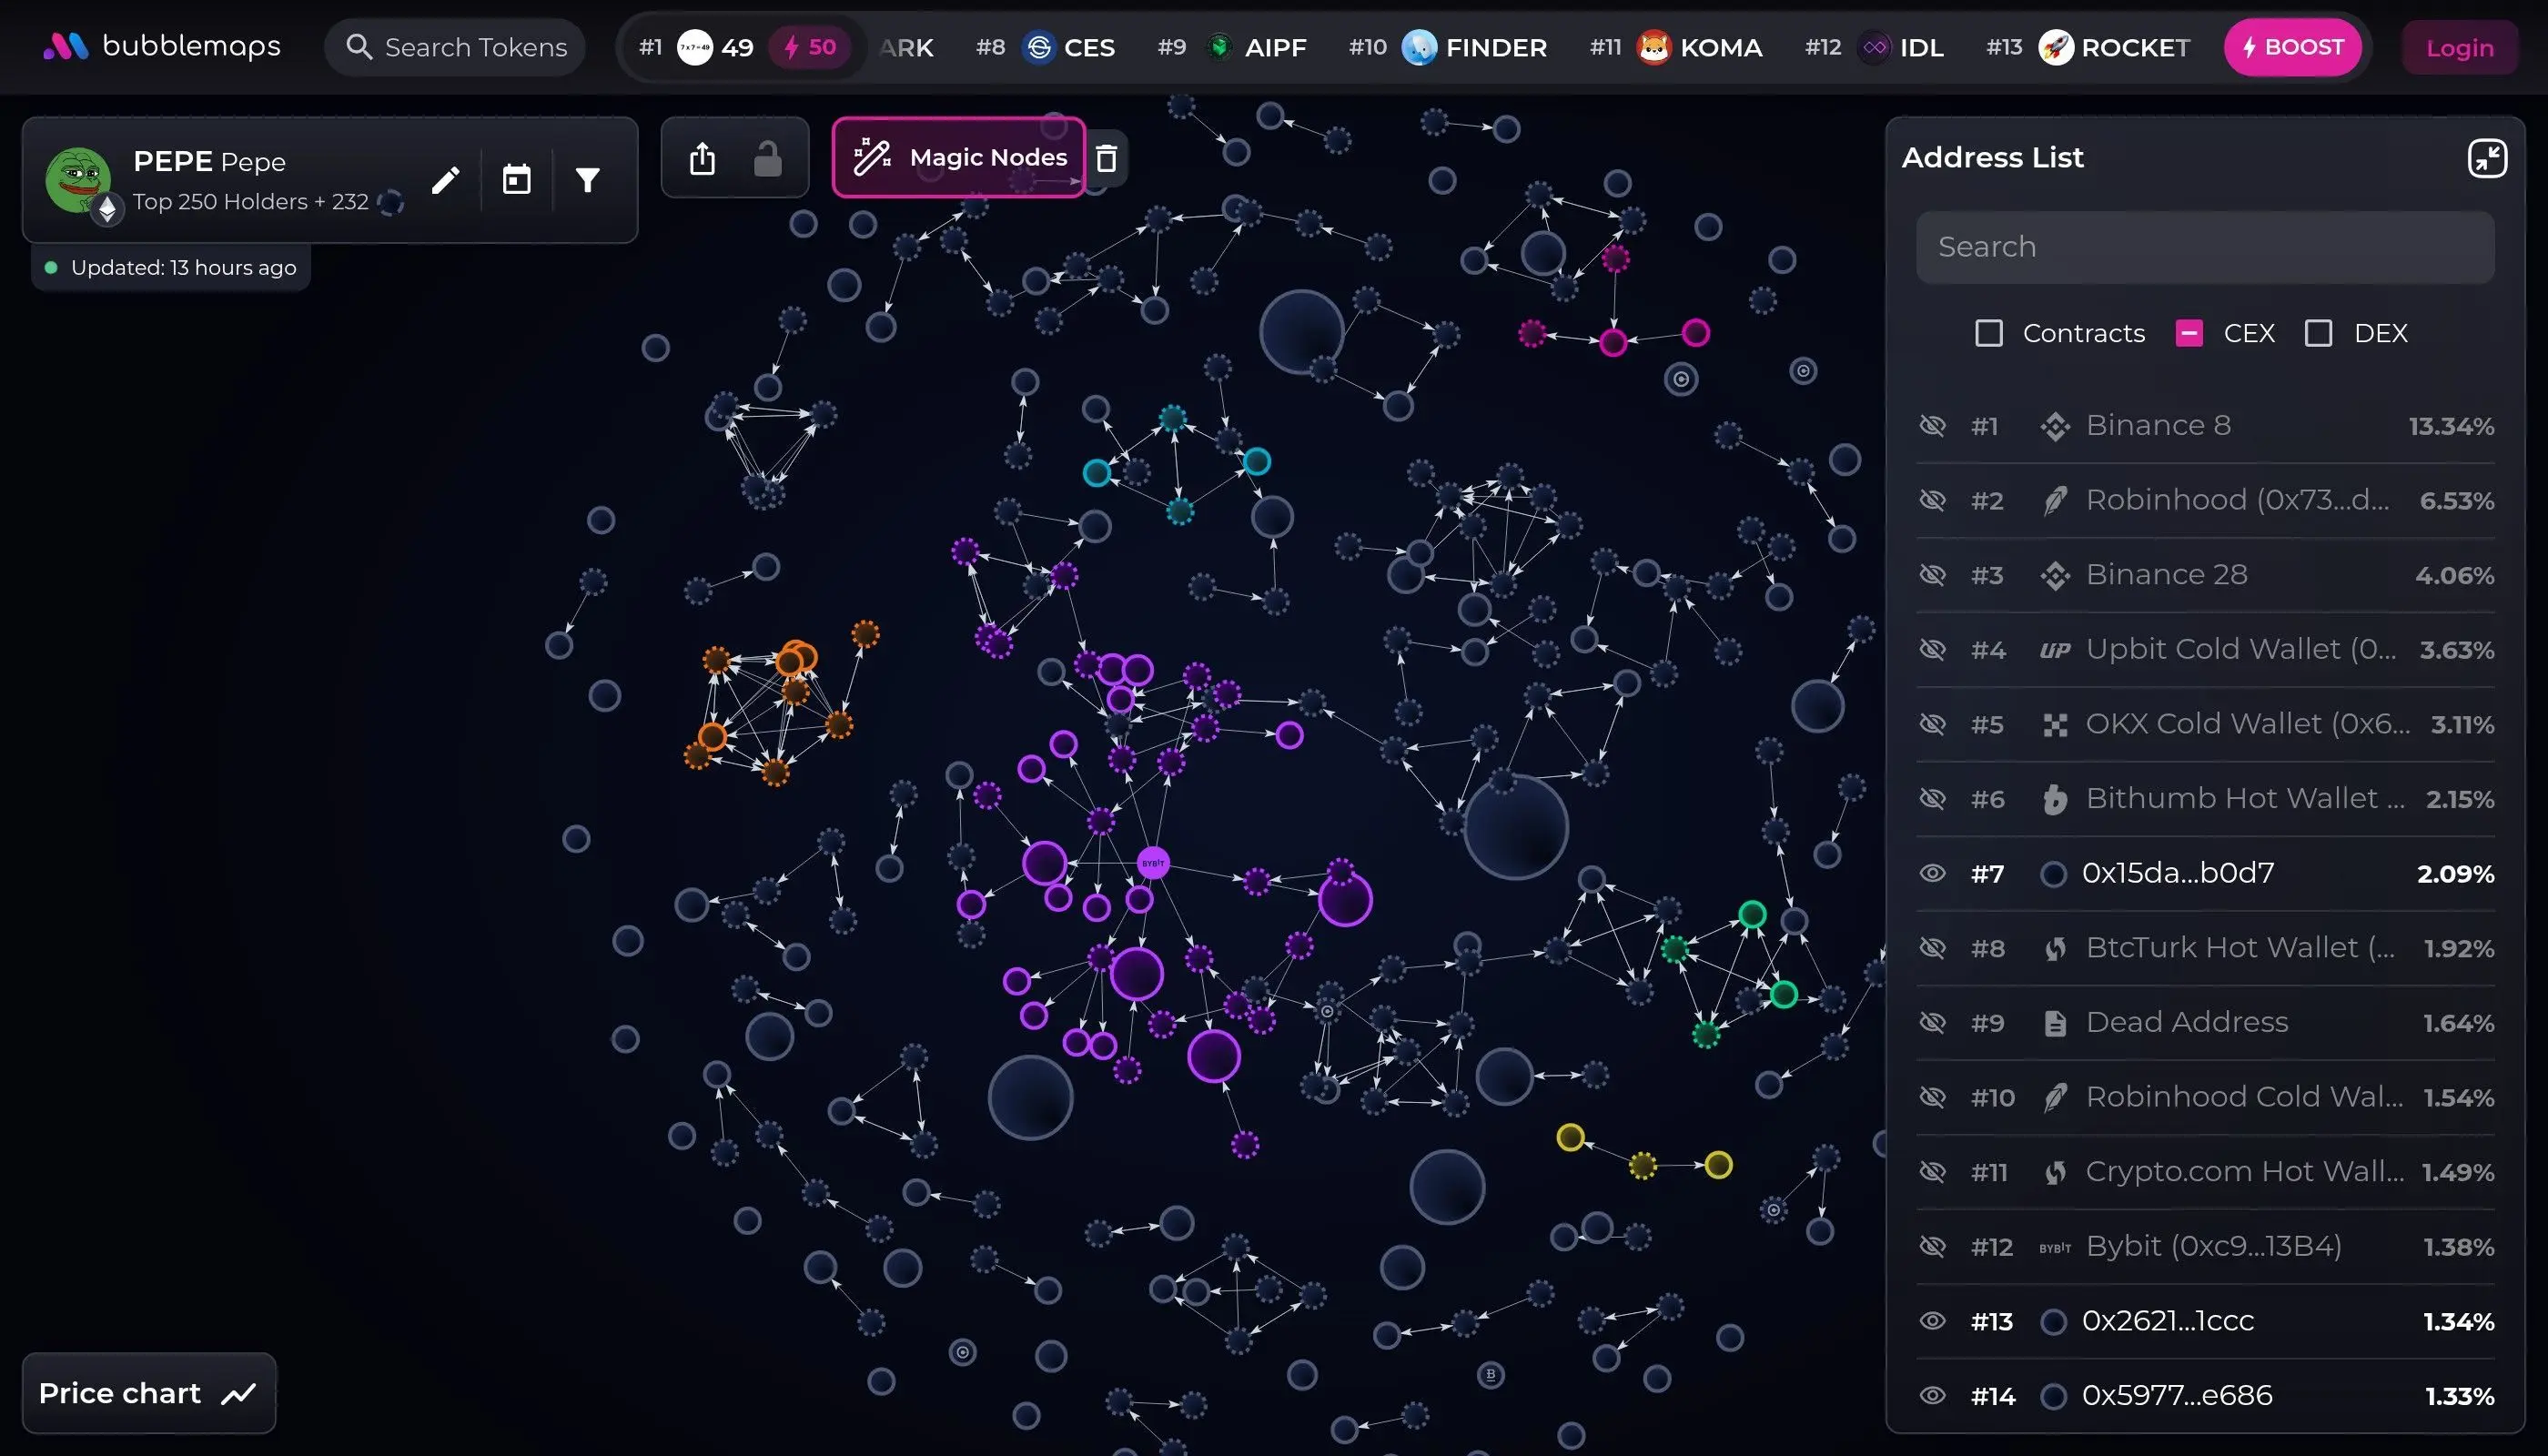
Bubblemaps is a blockchain analysis tool that visualizes token holder networks as interactive bubble clusters. Instead of scrolling through endless wallet addresses on a block explorer, you see immediately: who holds what, how wallets connect through transfers, and which wallets dominate the supply.
Each bubble represents a wallet. The size of the bubble is proportional to the amount of tokens held. Lines connecting bubbles show recent transfer activity. Clusters reveal wallets that move tokens between each other-the fingerprint of coordinated or insider activity.
The tool supports Ethereum, BSC, Polygon, Arbitrum, Optimism, Avalanche, Fantom, Base, and other major EVM chains. It works on any token: established coins, small-caps, new launches, everything. You can access the core feature set for free, with pro plans unlocking advanced analytics and alerts.
Why Token Manipulation Detection Matters
In 2024, rug pulls and token frauds extracted $2.8 billion from retail traders. Most of these schemes were preventable. The red flags were there-but they were hidden in data that standard tools don't surface.
Rug Pulls: A team deploys a token, collects liquidity from buyers, then uses hidden control over the liquidity pool to drain it instantly. Block explorers show the transaction, but Bubblemaps reveals the pattern: the liquidity provider wallet connected to the deployer, concentrated ownership, and suspicious pre-dump transfers.
Insider Wallets: Founders and investors often hold large portions of a project's supply. If those wallets are designed to look small (split across multiple addresses) while remaining connected, it signals manipulation intent. On Bubblemaps, those connections appear as a cluster-the true holder weight becomes obvious.
Sybil Supply Splitting: One person creates 100 wallets, distributes 1% to each, making the supply appear decentralized when it's fully under single control. Bubblemaps shows the transfer patterns-all 100 wallets receive tokens from the same source in the same block.
Wash Trading & Fake Volume: Coordinated wallets trade tokens back and forth to fake demand. Bubblemaps visualizes these loops, showing you tokens bouncing between the same cluster of addresses while price spikes and volume falsifies.
A standard block explorer shows transactions. Bubblemaps shows the intent behind them. That difference saves money.
Getting Started with Bubblemaps
Step 1: Visit bubblemaps.io
Open your browser and go to bubblemaps.io. No signup required for basic access. The interface is clean: a search bar at the top, settings on the left sidebar.
Step 2: Select Your Chain
Choose which blockchain you're analyzing: Ethereum, BSC, Polygon, Arbitrum, or others. This defaults to Ethereum but changes if you search a token on a different chain.
Step 3: Search the Token
Enter the token address or name in the search box. Bubblemaps fetches holder data and renders the visualization in seconds. The bubble map loads immediately-no waiting, no paywall interruption.
Step 4: Explore the Map
Click and drag to pan. Scroll to zoom in/out. Hover over bubbles to see wallet addresses, balances, and percentage of supply. Connections show transfers and transaction counts. The visualization updates in real-time as you interact.
That's it. No wallet connection required. No login. Bubblemaps works instantly.
Reading the Bubble Map
Every element on a Bubblemaps visualization carries information. Learning to read it turns token data into actionable risk assessment.
The larger the bubble, the more tokens that wallet holds. Size is proportional to supply percentage. A bubble covering 1/3 of the map = 33%+ of supply in one wallet. This is the primary risk indicator. Bigger = more concentrated = higher manipulation risk.
Lines between bubbles represent transfers. Thickness shows transfer volume or frequency. Multiple thin lines = many small transfers. One thick line = large transfer. Connections show which wallets are active in moving tokens. Coordinated clusters with dense connections suggest insider activity.
Different colors indicate wallet categories: blue for holders, orange for exchanges, green for liquidity pools, purple for contracts. The color scheme helps identify wallet type at a glance. Exchange wallets (orange) should hold minimal supply. Liquidity pools (green) should be locked or time-delayed.
Clusters are groups of closely connected bubbles. High density = wallets moving tokens between each other frequently. Low density = independent holders. Dense clusters near the deployer = insider group. Scattered clusters = organic distribution.
The golden rule: organic distributions are sparse and scattered. Manipulated tokens cluster tightly, with large bubbles connected by thick lines-the visual equivalent of a single entity spread across multiple addresses.
Five Red Flags to Watch For
These patterns consistently precede token collapses. When you spot them, proceed with extreme caution or exit entirely.
One massive bubble dominates the map. A single wallet or tight cluster controls more than 30% of circulating tokens. Risk: That whale can dump anytime, immediately tanking price by 20-50% before anyone can sell. If the whale is the deployer or team member, it's even more suspicious-they have inside knowledge of contract vulnerabilities and can exploit them. Action: Either avoid the token or size your position accordingly. Consider it extremely risky.
On the map, you see dozens of medium-sized bubbles, each holding 1-5% of supply, all receiving tokens from a central deployer address in the same block. Risk: Classic Sybil attack. One person created 50 wallets to disguise concentrated ownership. When they're ready, they'll move all tokens to a single address and dump. This completely fakes distribution metrics. Action: Check if the distribution transfer happened in the same transaction block. If yes, it's artificially created. High risk. Exit.
The green liquidity pool bubble has a thick connection to a large orange or purple bubble-the deployer or team member owns the liquidity pool contract. Risk: They can drain the pool anytime without warning. No liquidity lock = they can pull and instantly rug. Even if the price doesn't move on the candlestick, it's because no one can sell (no liquidity). Action: Check if the LP is locked on contracts like Unicrypt. If it's not locked and shows ownership, it's a red flag. Avoid.
The deployer address suddenly shows new thick connections to fresh wallets (with few transactions and young creation dates) in the last 24-48 hours. Risk: Pre-dump distribution. The team is moving tokens out of the main deployer address to minimize on-chain evidence before they exit. After separation, they'll dump all those wallets and claim they're just early investors or bots. Action: Use DEXTools to check if large holder wallets were created recently. New wallets = pre-dump setup. Exit immediately.
The token claims millions in volume, thousands of holders, and massive social media following. But the Bubblemaps visualization shows isolated bubbles with almost no transfer connections-it looks empty. Risk: Either the token data is fake (volume spoofed via bot trades), or the holder list is fake (airdropped to inactive addresses). Either way, real organic tokens show dense transfer activity. Action: Cross-check DEXTools volume and holder count. If metrics don't match reality, it's a scam. The absence of connections on a "busy" token is a red flag.
Real-World Example Walkthrough
Let's walk through analyzing a hypothetical memecoin launch called MOONCAT. It launched 48 hours ago, has 50,000 holders, $5M in liquidity, and claims to be "100% community-driven."
Step 1: Load the Map
You search MOONCAT on Bubblemaps. The visualization loads. Immediately you see: one large bubble (30% supply), connected to 15 medium bubbles (5-8% each), surrounded by hundreds of tiny bubbles (under 0.1% each).
Step 2: Assess Concentration
The large bubble is suspicious. But before panicking, you check: was this a team allocation in the whitepaper? Hover over it. The address is 0x1234abc... (the deployer address). The team kept 30% without disclosure. Red flag #1 triggered.
Step 3: Check Cluster Connections
You zoom in on the 15 medium bubbles. They're all connected to the deployer with thick lines, all created in the same transaction block (you can see by hovering). Red flag #2: Sybil distribution. The team isn't hiding-they're just splitting supply to avoid obvious concentration.
Step 4: Identify Liquidity Control
You look for the orange LP bubble. Found it-it's connected to the deployer with a thick line, and the deployer is the LP owner. The LP isn't locked (you'd see a lock indicator). Red flag #3: liquidity is pullable.
Decision: AVOID. MOONCAT fails at least three major red flags. The team controls 30% openly, hid another 75% in Sybil wallets, and owns the liquidity. One coordinated dump will collapse the token. You pass on the trade entirely.
Contrast: Healthy Distribution
A safe token shows a different pattern. Hundreds of bubbles of similar size (all under 2% each). The deployer holds maybe 5-10%. Connections are scattered, not clustered. New transactions show organic spreading from small holders to smaller holders. No single entity controls the LP. The visualization is chaotic-a good sign that distribution is truly decentralized.
Bubblemaps + DEXTools Combo: The Complete DYOR Stack
Bubblemaps is powerful alone. But combined with DEXTools, you get a complete picture of token health and opportunity.
Bubblemaps reveals: Holder concentration, cluster patterns, insider control, liquidity ownership, distribution fairness.
DEXTools reveals: Price action, liquidity depth, trading volume authenticity, contract audit scores, liquidity lock status, rugcheck results.
Your workflow:
- Step 1: Open DEXTools - Search the token, check audit score, verify LP is locked, confirm volume is real (not bot-generated spikes)
- Step 2: Open Bubblemaps - Load the holder map, identify red flags, assess concentration and cluster patterns
- Step 3: Cross-Reference - If DEXTools shows holder count as 50,000 but Bubblemaps shows 200 bubbles (likely fabricated), they don't match. Cross-reference wallet creation dates with Bubblemaps timestamps
- Step 4: Decide - If both tools pass (no red flags, good audit, fair distribution, locked LP), it might be tradeable. If either fails, avoid
- Step 5: Trade (Optional) - Set tight stops, take profits at 20-30%, never chase. Let Bubblemaps holder data guide your exit: if the large holders start moving tokens, it signals a dump coming
DEXTools is your dashboard. Bubblemaps is your security camera. Use both.
Free vs Pro: Features Comparison
The verdict: The free tier is genuinely usable for serious traders. You get all the core analysis tools. The pro tier is valuable if you're running alerts on 50+ tokens or need API access for bots. Most retail traders stay free forever.
Pros & Cons
- Free, unlimited access to core features
- Works on 10+ EVM chains instantly
- Visualizes insider and Sybil patterns clearly
- No login required, privacy-friendly
- Real-time data updates
- Identifies rug pull red flags instantly
- Can't distinguish between wallets by intent
- Free tier lacks wallet tracking alerts
- Interface requires some learning curve
- Doesn't assess contract security (use DEXTools for that)
- Pro tier ($99/month) is pricey for casual use
- Cluster patterns can be misleading for exchange wallets
Frequently Asked Questions
Can I use Bubblemaps on all tokens?
Yes. Any token on Ethereum, BSC, Polygon, Arbitrum, Optimism, Avalanche, Fantom, or other EVM chains works. Just search the token address or name. Bubblemaps pulls on-chain data and renders it instantly.
Does Bubblemaps show who created the token?
Indirectly. The deployer address is visible on the map (usually as a central hub with outgoing connections). You can hover and see the address. To find the team behind that address, use block explorers or Etherscan to check if it's labeled. For anonymous tokens, there's no way to identify the creator directly-which is a red flag itself.
What if a token's Bubblemaps looks good but the price dumps anyway?
Bubblemaps prevents obvious rug pulls and Sybil attacks-but can't predict market sentiment. A token could have fair distribution and still dump due to poor marketing, bad macro conditions, or simply being a bad project. Bubblemaps is one tool, not crystal ball. Combine it with DEXTools, fundamentals, and risk management.
Can I track whale wallets on Bubblemaps?
The free tier lets you see whale bubbles and their connections. The pro tier includes wallet tracking, which sends alerts if a large holder moves tokens-useful for exit signals. For most traders, visually monitoring the map manually is sufficient.
Should I trust a token if it passes Bubblemaps but fails DEXTools audit?
No. A fair distribution doesn't mean the smart contract is secure. DEXTools audit catches things like hidden tax functions, mint/burn vulnerabilities, and reentrancy bugs. Bubblemaps catches social manipulation. Use both. A token needs to pass both to be safe.
Ready to Use Bubblemaps?
Start analyzing token holder distributions instantly. No signup. No fees. Just copy the token address and let Bubblemaps reveal the truth.
Visit BubblemapsRelated Articles
Complete framework for evaluating tokens: contract analysis, team vetting, tokenomics, and risk assessment.
Strategies for finding and trading fresh token launches before price explosion using DEXTools.
Discover emerging tokens before mainstream adoption via community signals, contract creation tracking, and token launchpads.
Related Tutorials
How to Snipe New Token Launches on DEXTools
Step-by-step sniping strategies, safety checks, and bot comparisons.
Slippage Explained: How to Set It Right on Any DEX
Why DEX trades fail and how to set slippage tolerance correctly.
How to Revoke Token Approvals for Wallet Security
Protect your wallet by revoking unlimited token approvals.
What Is a Smart Contract - Complete Guide
Understand smart contracts and why they matter in DeFi.