Crypto Trading Strategies: The Complete 2026 Guide (25+ Strategies for Every Level)
— By Tony Rabbit in Tutorials
Master 25+ crypto trading strategies from day trading and scalping to DeFi yield optimization and on-chain analysis. Comprehensive guide covering technical analysis, risk management, portfolio construction, backtesting frameworks, and trading psychology for beginners and intermediate traders.
Cryptocurrency trading has evolved from a niche hobby into a global financial ecosystem worth trillions of dollars in daily volume. Whether you are a complete beginner placing your first market order or an intermediate trader looking to refine your edge, understanding the full spectrum of trading strategies is the single most important step you can take toward consistent profitability. This guide compiles over 25 distinct strategies, frameworks, and analytical approaches into one comprehensive resource, covering everything from classic day-trading setups to advanced DeFi yield optimization and on-chain intelligence.
Markets do not reward traders who rely on a single tactic. The best performers adapt across timeframes, combine multiple signals, and treat risk management as non-negotiable. Throughout this article you will find detailed explanations with real examples, comparison tables, practical checklists, and visual breakdowns designed to help you internalize each concept instead of simply reading about it.
Every section stands on its own, so you can jump directly to a specific strategy using the Table of Contents. However, we strongly recommend reading the Risk Management and Trading Psychology sections regardless of which strategies interest you, as these two pillars determine whether any strategy succeeds or fails in practice.
Who Is This Guide For?
- Beginners who want a structured roadmap from basic concepts to execution
- Intermediate traders seeking new strategies or ways to combine existing ones
- DeFi participants interested in yield strategies, on-chain signals, and DEX arbitrage
- Portfolio managers looking for construction frameworks and allocation models
Understanding Trading Timeframes
Before diving into individual strategies, it is critical to understand how timeframes shape every aspect of your trading. The timeframe you choose determines which chart intervals you monitor, how long you hold positions, how much capital you need, and even how you structure your daily routine. Choosing the wrong timeframe for your personality or lifestyle is one of the most common reasons new traders fail, even when they apply a technically sound strategy.
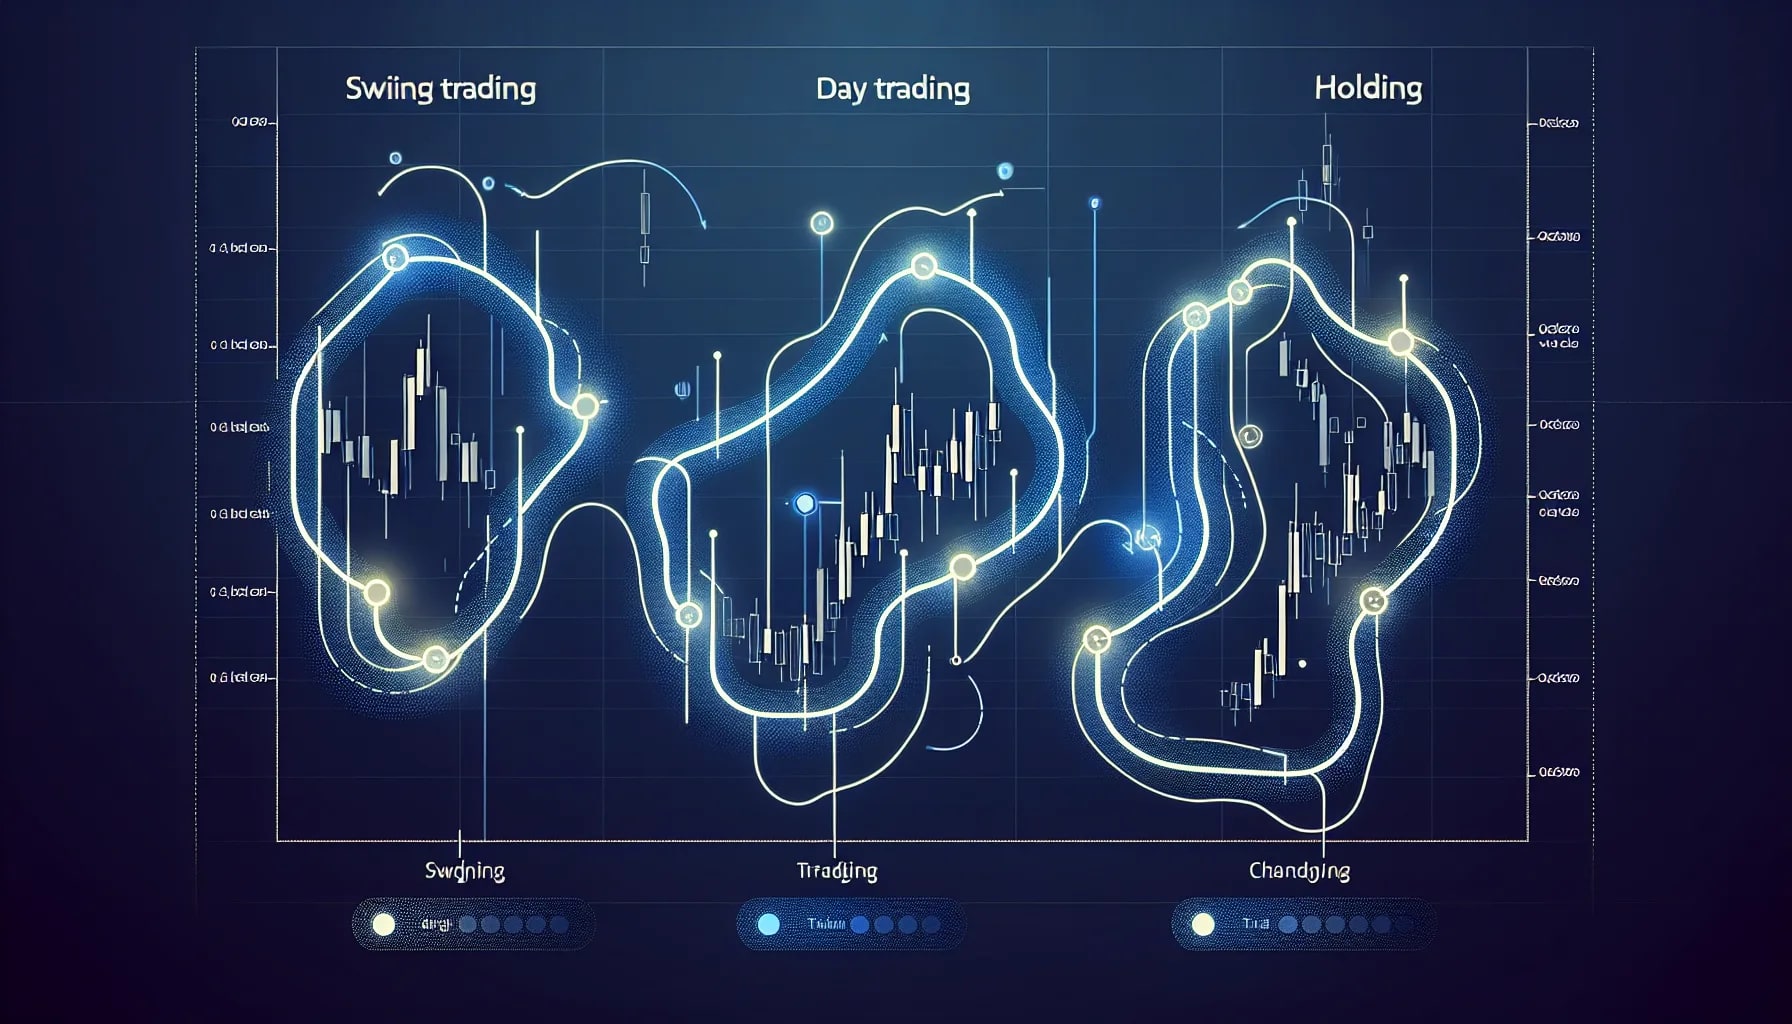
Timeframes in crypto generally fall into four categories: scalping (seconds to minutes), day trading (intraday), swing trading (days to weeks), and position trading (weeks to months). Each has unique risk profiles, capital requirements, and psychological demands.
Notice how capital requirements scale inversely with holding period. Scalpers need larger accounts to absorb commissions and slippage across hundreds of trades, while position traders can start with less because they capture larger moves and pay fewer fees relative to their profits.
Choosing Your Timeframe -- Quick Decision Tree
- Can you monitor charts for 4+ hours daily? → Day trading / Scalping
- Available 30 -- 60 minutes in the evening? → Swing trading
- Prefer a hands-off approach with weekly reviews? → Position trading / DCA
- Want to combine active and passive? → Core-satellite portfolio (covered later)
Many successful traders combine two timeframes: a higher timeframe for directional bias and a lower timeframe for entry timing. For example, you might use the daily chart to identify that Bitcoin is in an uptrend, then switch to the 4-hour chart to find pullback entries. This multi-timeframe approach is referenced throughout the strategies below.
Day Trading Strategies
Day trading involves opening and closing all positions within the same trading session. In crypto, where markets never close, "same session" typically means within a single waking period or a self-imposed cutoff (e.g., no positions held overnight). The appeal of day trading is clear: you avoid overnight gap risk, compound gains quickly, and can profit in both rising and falling markets. The downside is that it demands intense focus, fast execution, and robust risk controls.
The crypto market is particularly well-suited to day trading because of its high volatility, 24/7 access, and deep liquidity on major pairs. Bitcoin alone regularly moves 2-5% in a single day, providing ample opportunity for intraday traders. However, this same volatility can destroy undisciplined accounts rapidly.
VWAP Reversion Strategy
The Volume Weighted Average Price (VWAP) represents the average price an asset has traded at throughout the day, weighted by volume. Institutional traders use VWAP as a benchmark, which makes it a self-fulfilling level of interest. When price deviates significantly from VWAP, there is a statistical tendency for it to revert.
In practice, this strategy works best during periods of moderate volatility. During trending days, price can stay above or below VWAP for hours, so you need a filter. The most reliable setup combines VWAP with Bollinger Bands: enter when price touches the outer Bollinger Band while simultaneously being extended from VWAP by at least 1.5 standard deviations.
VWAP Reversion -- Setup Checklist
- Calculate VWAP from the start of the trading day (use midnight UTC for crypto)
- Add Bollinger Bands (20-period, 2.0 SD) to your chart
- Wait for price to touch or pierce the outer Bollinger Band
- Confirm that price is at least 1.5% away from VWAP
- Enter a mean-reversion trade toward VWAP with a stop-loss beyond the Bollinger Band extreme
- Take profit at VWAP or at the opposite Bollinger Band (half position at each)
Win rates for VWAP reversion typically range from 55-65% with a risk-reward ratio of approximately 1:1.2. The edge comes from consistency and volume rather than large individual wins. Expect to take 5-10 trades per day on major pairs like BTC/USDT and ETH/USDT.
Opening Range Breakout (ORB)
The Opening Range Breakout strategy adapts a classic equity-market technique for crypto. Since crypto never closes, you define an artificial "opening range" based on a fixed time window, typically the first 30 or 60 minutes after midnight UTC or after a major market open (e.g., US equities at 9:30 AM ET, which often drives crypto volatility).
The logic is straightforward: the first 30-60 minutes of a session often represent an equilibrium zone where major participants establish their positions. A decisive breakout from this range signals the directional bias for the rest of the session. You go long above the range high or short below the range low, with a stop inside the range.
An important filter: skip ORB trades when the overnight range is abnormally wide (more than 2x the 20-day average range), as this suggests the directional move may have already occurred. Also avoid ORB on days with major scheduled events (FOMC, CPI) as the real move often comes after the announcement rather than at the open.

Intraday Momentum Ignition
Momentum ignition occurs when a rapid price move triggers a cascade of stop-losses and liquidations, creating a self-reinforcing wave. In crypto, these events happen frequently because of the prevalence of leveraged positions. When a cluster of long liquidations fires at a key level, the resulting sell pressure pushes price further down, triggering more liquidations in a waterfall effect.
To trade momentum ignition, you need to identify where liquidation clusters sit. Tools like Coinglass, Hyblock Capital, and exchange open-interest data show you where leveraged positions are concentrated. The strategy is to enter in the direction of the liquidation cascade once it begins, riding the momentum until the selling or buying pressure exhausts.
Key signals that momentum ignition is likely: a prolonged period of low volatility (compression), rising open interest without price movement, and a clear level where stop-losses are clustered (visible as equal lows or equal highs on the chart). When price finally breaks through this level on volume, you enter immediately with a tight stop just beyond the breakout point.
Warning: Momentum Ignition Risks
These trades can reverse violently. Liquidation cascades sometimes trigger counter-cascades in the opposite direction within minutes. Always use a stop-loss and never risk more than 1% of your account on a single momentum-ignition trade. If the move does not continue within 5 minutes of your entry, consider exiting at breakeven.
Market-Making Intraday
Market-making involves placing simultaneous buy and sell limit orders around the current price, profiting from the bid-ask spread. While institutional market makers use sophisticated algorithms, retail traders can apply a simplified version by placing limit orders at support and resistance levels within a tight intraday range.
The key to intraday market-making is identifying ranging conditions. When an asset is consolidating within a clear channel, you place buy orders near the bottom of the range and sell orders near the top. Your profit is the difference between your average buy and sell prices. This works best on high-volume pairs where the spread is tight and fills are reliable.
Capital efficiency is a concern because you need to keep orders active on both sides. A typical approach is to allocate 5-10% of your portfolio specifically for market-making activities, with strict rules to pull all orders if price breaks out of the defined range. This prevents you from accumulating a directional position during a trend.
Swing Trading Strategies
Swing trading occupies the sweet spot for most retail crypto traders. It provides enough action to stay engaged without requiring you to sit in front of charts all day. Swing traders typically hold positions for 2-14 days, capturing medium-term price "swings" between support and resistance levels. The per-trade profit target is larger than day trading (typically 5-15% per swing), but the trade frequency is lower.
What makes swing trading particularly effective in crypto is the market's tendency to move in pronounced waves. Bitcoin and major altcoins frequently establish a trend, pull back to a support level, and then resume the trend. These pullbacks create high-probability entry points for swing traders who can identify the broader trend direction.
Pullback-to-Moving-Average Strategy
This is the bread-and-butter swing trading strategy and one of the highest-probability setups in crypto markets. The concept is simple: in an established uptrend, price periodically pulls back to a key moving average before bouncing higher. The 21-period EMA and 50-period SMA on the daily chart are the two most commonly used levels for this strategy.
The setup process begins with trend identification. You want to see a clear series of higher highs and higher lows on the daily chart, with the 21 EMA sloping upward and price trading above the 50 SMA. When price pulls back to touch or briefly dip below the 21 EMA, you look for a bullish reversal signal: a hammer candlestick, a bullish engulfing pattern, or simply a green daily close after the touch.
Pullback Entry -- Step by Step
- Confirm the asset is in an uptrend (price above 50 SMA, 21 EMA above 50 SMA)
- Wait for price to pull back to the 21 EMA on the daily chart
- Look for a bullish reversal signal on the daily or 4H chart
- Enter on the next candle open after the reversal signal
- Place stop-loss below the recent swing low or below the 50 SMA
- Target 1: Previous swing high (take 50% profit)
- Target 2: 1.618 Fibonacci extension of the pullback (close remaining 50%)
The beauty of this strategy is its objectivity. Every element is measurable and rule-based, which removes much of the emotional decision-making that plagues discretionary traders. Backtesting this approach on BTC/USDT daily data from 2020-2025 shows a win rate of approximately 62% with an average risk-reward ratio of 1:2.3, producing a solid positive expectancy.
Fibonacci Retracement Swing Setup
Fibonacci retracement levels are derived from the mathematical Fibonacci sequence and represent potential support and resistance zones where price may reverse during a pullback. The key levels are 0.236, 0.382, 0.5, 0.618, and 0.786. In crypto, the 0.618 and 0.5 levels are the most significant, often acting as magnets for price during corrections.
To use Fibonacci retracements for swing trading, you draw the tool from the most recent significant swing low to swing high (for uptrends) or high to low (for downtrends). When price retraces to the 0.5-0.618 zone, this represents the "golden pocket" where institutional buyers often step in. Combining this zone with a horizontal support level or moving average creates a high-confluence entry.
The stop-loss goes below the 0.786 retracement level, and the profit target is the previous swing high (conservative) or the 1.272/1.618 extension (aggressive). One key rule: if price closes below the 0.786 level on a daily candle, the retracement thesis is invalidated and you should exit immediately, as the trend may be reversing.
Multi-Timeframe Swing Analysis
The most reliable swing trades occur when multiple timeframes agree on direction. The three-timeframe approach works as follows: use a higher timeframe (weekly) to determine the macro trend, a middle timeframe (daily) to identify swing entry zones, and a lower timeframe (4H) to pinpoint exact entries.
For example, if the weekly chart shows Bitcoin in a clear uptrend above all major moving averages, the daily chart shows a pullback to the 21 EMA, and the 4H chart prints a bullish engulfing candle at that level, you have triple-timeframe confirmation. This convergence dramatically increases the probability of a successful trade compared to relying on a single timeframe.

A common mistake is conflicting timeframe interpretation. If the weekly is bearish but the daily shows a short-term bounce, you should either avoid the trade entirely or treat it as a counter-trend scalp with a very tight stop and reduced position size. Never fight the higher timeframe trend with full risk.
Scalping Strategies
Scalping is the fastest form of trading, aiming to capture tiny price movements (0.1-0.5%) across dozens or even hundreds of trades per day. Scalpers are the sprinters of the trading world: they need lightning-fast reflexes, low-latency execution, and the discipline to take small losses instantly when a trade goes against them. The profit per trade is minuscule, but the compounding effect of many small wins can produce impressive daily returns.
Crypto scalping has become increasingly competitive with the rise of algorithmic trading, but there are still niches where manual scalpers thrive, particularly during high-volatility events, on newly listed tokens, and in DeFi markets where bots face MEV challenges. The key to survival as a scalper is keeping your win rate above 60% while maintaining a risk-reward ratio of at least 1:1.
Order Flow Scalping
Order flow scalping reads the tape (the stream of actual buy and sell orders) to detect institutional activity. Large market orders that consume visible liquidity signal strong directional intent. When you see a cluster of large buy orders hitting the ask (aggressive buying), it suggests a whale or institution is accumulating, and price is likely to move higher in the short term.
Tools for order flow analysis include exchange-provided order book heatmaps, third-party services like Bookmap and Tensorcharts, and the raw trade history on exchanges. The most actionable signal is "absorption": when a large limit order sits at a key level and absorbs all incoming market orders without the price moving. This indicates a strong buyer or seller defending that level, and you can trade in their direction once the opposing flow subsides.
Order Flow Scalping -- Key Signals
- Absorption: Large limit order holds against repeated market sells → buy signal
- Stacking: Multiple large limit orders appearing at the same level → strong support/resistance
- Spoofing detected: Large order disappears before being filled → ignore that level
- Delta divergence: Price making new highs while cumulative delta is falling → weakness signal
- Volume clusters: High volume at a price level with minimal price movement → accumulation/distribution
Spread Scalping on DEXs
Decentralized exchanges often have wider spreads than centralized ones, creating opportunities for manual spread scalpers. On AMM-based DEXs, the effective spread widens during low-liquidity periods, and you can profit by acting as an informal market maker: buying at the lower end of the effective spread and selling at the upper end.
This requires careful attention to gas costs (on Ethereum) or transaction fees (on Solana, BSC). A trade that captures 0.3% profit means nothing if gas costs eat 0.5%. The best opportunities arise on Solana-based DEXs like Raydium and Jupiter, where transaction costs are negligible, and on newly launched token pairs where spreads can be 1-3%.
One advanced technique is "sandwiching" your own orders across multiple pools. If Token A/USDC has different prices on Raydium and Orca, you can buy on the cheaper exchange and sell on the more expensive one simultaneously. While this sounds like arbitrage (covered later), at the scalping level it is done manually on small size with rapid execution, focusing on the spread differential rather than the absolute price difference.
News Scalping
News scalping exploits the immediate price reaction to breaking news. In crypto, news hits differently than in traditional markets because there are no circuit breakers or trading halts. A single tweet from a major influencer or a surprise regulatory announcement can move prices 5-10% in seconds.
The setup requires monitoring multiple news sources simultaneously: Twitter/X lists of crypto influencers and journalists, Telegram groups with on-chain alert bots, and aggregators like CoinDesk and The Block. When a significant headline breaks, you have approximately 10-30 seconds to assess its impact and execute a trade before the initial move is priced in.
The critical skill in news scalping is rapid impact assessment. Not all headlines matter. A protocol hack is almost always bearish for the token. A major exchange listing is almost always bullish. Regulatory news requires more nuanced analysis. The best news scalpers develop a mental framework for categorizing news by expected impact magnitude and direction, allowing them to react instantly.
Position Trading and Long-Term Strategies
Position trading represents the longest active trading timeframe, with positions held for weeks to months. It sits between swing trading and pure buy-and-hold investing. Position traders use fundamental analysis, macro cycles, and long-term technical patterns to identify major trend changes, then ride those trends for substantial profits.
In the crypto market, position trading aligns naturally with the pronounced boom-and-bust cycles driven by Bitcoin's halving schedule. Traders who can identify the transition from bear to bull markets early and establish positions before the crowd arrive stand to capture 5-20x returns on major altcoins during bull runs.
Cycle-Based Positioning
Bitcoin's four-year halving cycle has historically produced a reliable pattern: accumulation in the 12-18 months following a bear market bottom, followed by a parabolic bull phase, a blow-off top, and then a prolonged correction. While no cycle repeats exactly, understanding where you are in the current cycle provides a powerful macro framework for position trading.
Key indicators for cycle positioning include: the MVRV Z-Score (which measures market value vs. realized value), the NUPL (Net Unrealized Profit/Loss) indicator, the Pi Cycle Top indicator, and the 200-week moving average. When MVRV Z-Score drops below 0 and the price trades near or below the 200-week MA, historically these have been optimal accumulation zones. Conversely, when MVRV Z-Score exceeds 7 and NUPL enters the "euphoria" zone, it signals potential cycle tops.
Bitcoin Cycle Phases -- Action Plan
Altcoin Rotation Strategy
Within a bull cycle, capital tends to flow in a predictable sequence: Bitcoin first, then Ethereum and large-caps, then mid-caps, and finally small-caps and meme coins. This rotation pattern creates opportunity for position traders who can time their allocations across market-cap tiers.
The strategy involves monitoring Bitcoin dominance (BTC.D). When BTC dominance is rising, you concentrate holdings in Bitcoin. When BTC.D begins to decline after a sustained uptrend, this signals the start of "altseason" and you rotate into Ethereum and quality altcoins. The key metric to watch is the ETH/BTC ratio: when it begins to rise alongside falling BTC.D, the rotation into alts is confirmed.
Position sizing during rotation follows a waterfall model. Start with 60-70% BTC during the early bull phase. As altseason signals trigger, gradually shift to 30% BTC / 30% ETH / 40% selected alts. In the late euphoria phase, reduce overall crypto exposure regardless of the allocation mix. This systematic approach captures the bulk of the bull-market returns while reducing the risk of being caught in an altcoin collapse when the cycle turns.
Momentum Trading
Momentum trading is based on a simple but powerful observation: assets that have been rising tend to continue rising, and assets that have been falling tend to continue falling. This persistence of direction, known as price momentum, is one of the most well-documented market anomalies across all asset classes, and it is particularly strong in crypto due to the market's narrative-driven nature and the feedback loop between price action and social media attention.
Academic research has consistently shown that momentum strategies generate positive returns in crypto. A study by Liu, Tsyvinski, and Wu (2022) found that a simple momentum strategy of buying the top-performing cryptocurrencies from the previous week and selling the worst performers produced annualized returns exceeding 50% before transaction costs. While real-world implementation involves slippage and fees, the core momentum effect remains robust.
Relative Strength Momentum
Relative strength momentum compares the performance of multiple assets and allocates to the strongest performers. Instead of trying to predict which coins will go up, you simply buy what is already going up the most and hold until it shows weakness relative to its peers.
Implementation: Each week, rank the top 50 cryptocurrencies by market cap based on their 14-day rate of change (ROC). Buy the top 5 and hold for one week. At the end of the week, re-rank and rebalance. If a coin drops out of the top 5, sell it and replace it with the new entrant. To filter out noise, add a minimum threshold: only buy coins with a positive ROC above a certain level (e.g., 5% over 14 days).
Absolute Momentum Filter
Relative momentum alone has a critical weakness: during bear markets, even the "strongest" crypto is still falling. Absolute momentum adds a crash filter: only take momentum trades when the overall market trend is positive. The simplest absolute momentum filter is whether Bitcoin is above its 200-day simple moving average. If BTC is below the 200 SMA, go to stablecoins regardless of individual coin momentum.
Combining relative and absolute momentum creates what is known as "dual momentum." This approach has historically captured 70-80% of bull market upside while avoiding 60-70% of bear market drawdowns. The tradeoff is that you may enter late and exit late, missing some of the initial recovery and enduring some of the initial decline, but the net effect on risk-adjusted returns is strongly positive.
Pro Tip: Momentum + Volume Confirmation
Momentum signals are much more reliable when accompanied by rising volume. A coin rising 10% on 3x average volume is far more likely to continue than one rising 10% on low volume. Add a volume filter requiring that the 7-day average volume is at least 1.5x the 30-day average volume before entering a momentum trade.
Mean Reversion Strategies
If momentum trading bets that trends persist, mean reversion bets that extremes are temporary and prices eventually return to their average. These two approaches are philosophically opposite, yet both work in crypto because the market alternates between trending and ranging regimes. The key is identifying which regime you are in and applying the appropriate strategy.
Mean reversion works best during ranging or choppy markets, which account for roughly 60-70% of the time in crypto. During strong trends, mean reversion trades get crushed, so filtering is essential. The most reliable mean reversion setups combine statistical deviation (price is X standard deviations from its mean) with exhaustion signals (volume divergence, RSI extremes) and structural levels (support/resistance).
Bollinger Band Mean Reversion
Bollinger Bands consist of a 20-period simple moving average (the mean) with bands plotted 2 standard deviations above and below. Approximately 95% of price action falls within the bands, so touches of the outer bands represent statistical extremes. The classic mean reversion trade buys at the lower band and sells at the upper band, with the middle band (20 SMA) as the first profit target.
In crypto, the standard 20-period, 2-standard-deviation settings work well on the 4-hour and daily timeframes. For shorter timeframes (15m, 1H), consider tightening to 1.5 standard deviations to account for the higher noise level. The most critical filter is bandwidth: only trade mean reversion when the Bollinger Bandwidth (the percentage distance between the bands) is above its 50-period average. Narrow bands indicate compression and an imminent breakout, where mean reversion will fail.
RSI Extreme Reversion
The Relative Strength Index (RSI) measures the speed and magnitude of recent price changes on a scale of 0 to 100. Traditional overbought and oversold levels are 70 and 30 respectively, but in crypto's volatile environment, using 80 and 20 as extreme levels produces more reliable signals.
The strategy: when RSI drops below 20 on the daily chart, begin scaling into a long position. Add to the position if RSI drops further to 15 or below. Set a stop-loss at 10% below your average entry or below a key technical level, whichever is tighter. Take profit when RSI crosses back above 50, indicating mean reversion is underway.
RSI Reversion -- Performance Metrics (BTC Daily, 2020-2025)
As the table shows, more extreme RSI levels produce higher win rates and better returns, but occur far less frequently. A practical approach is to use RSI < 30 as a watchlist trigger and RSI < 20 as the actual entry signal, with RSI < 15 reserved for maximum position sizing.
Breakout Trading
Breakout trading aims to enter a position when price decisively moves beyond a defined range, support/resistance level, or chart pattern boundary. The logic is that a breakout signals a shift in supply/demand dynamics, often triggering a cascade of stop orders and fresh entries that propel price further in the breakout direction. In crypto, breakouts can be explosive due to the leverage-driven nature of the market.
The biggest challenge with breakout trading is false breakouts, sometimes called "fakeouts." Studies suggest that 50-60% of crypto breakouts fail, meaning price briefly moves beyond the range only to reverse. This is why confirmation and volume filters are essential components of any breakout strategy.
Horizontal Range Breakout
The simplest and often most effective breakout trade occurs when price has been consolidating within a clear horizontal range for an extended period (at least 10-15 candles on your timeframe). The longer the consolidation, the more powerful the eventual breakout tends to be, because more orders accumulate at the range boundaries.
Entry rules: wait for a candle to close beyond the range boundary (not just a wick). Confirm with volume that is at least 2x the 20-period average volume. Enter on the close or on a small pullback to the broken level (which often acts as support/resistance after the breakout). Stop-loss goes inside the range, typically at the midpoint for aggressive traders or the opposite boundary for conservative traders.
Chart Pattern Breakouts
Classic chart patterns like ascending triangles, symmetrical triangles, bull flags, and cup-and-handle formations provide structured breakout setups with measurable targets. Each pattern has a defined breakout point and a measured move target based on the pattern's dimensions.

Volatility Squeeze Breakout
The volatility squeeze, also known as the "TTM Squeeze" or "Bollinger-Keltner Squeeze," occurs when Bollinger Bands contract inside Keltner Channels. This signals extremely low volatility, which inevitably resolves with a sharp directional move. Statistically, the move following a squeeze is the most predictable trade in technical analysis.
Setup: overlay Bollinger Bands (20, 2.0) and Keltner Channels (20, 1.5 ATR) on the same chart. When all four Bollinger Bands are inside the Keltner Channels, the squeeze is "on." When the Bollinger Bands expand back outside the Keltner Channels, the squeeze "fires" and you enter in the direction of the initial move. The squeeze direction can be anticipated using the momentum oscillator (histogram): if momentum is positive when the squeeze fires, go long; if negative, go short.
In crypto, volatility squeezes on the daily chart typically produce moves of 10-25% over the following 5-10 days. On the 4H chart, expect 5-12% moves over 1-3 days. The win rate is approximately 60-65%, but the payoff is asymmetric because winning trades tend to capture the entire squeeze-expansion move while losing trades are stopped out quickly inside the range.
Trend Following
Trend following is one of the oldest and most consistently profitable trading approaches across all markets. The core principle is deceptively simple: identify the direction of the prevailing trend and position yourself accordingly. Never predict when a trend will end; instead, stay in the trade until the trend objectively reverses. This means trend followers give back a portion of their profits at every turn, but they capture the bulk of major moves.
In crypto, trend following is particularly effective because of the market's tendency to produce extended, momentum-driven trends. Bitcoin rallied from $3,800 to $69,000 between March 2020 and November 2021, and a simple trend-following system would have captured the majority of that move. The challenge is surviving the inevitable drawdowns and false signals during choppy, ranging periods.
Moving Average Crossover Systems
The most common trend-following system uses two moving averages of different lengths. When the shorter MA crosses above the longer MA (a "golden cross"), it generates a buy signal. When the shorter crosses below (a "death cross"), it generates a sell signal. The most popular combinations in crypto are the 9/21 EMA crossover for swing traders and the 50/200 SMA crossover for position traders.
The 9/21 EMA system on the daily chart is a workhorse strategy for crypto. It captures medium-term trends while filtering out much of the daily noise. Backtesting on BTC/USDT from 2018-2025 shows an average annual return of approximately 45% with a maximum drawdown of 28%, compared to buy-and-hold's average return of 55% but with a maximum drawdown of 75%. The trend-following system sacrifices some upside for dramatically reduced risk.
Moving Average Systems -- Comparison
*Data based on BTC/USDT daily backtests, 2018-2025. Expectancy = (Win% x Avg Win) - (Loss% x Avg Loss)
ADX Trend Strength Filter
The Average Directional Index (ADX) measures trend strength on a scale of 0 to 100, without indicating direction. An ADX above 25 signals a trending market, while below 20 suggests a ranging market. Combining ADX with a moving average crossover system dramatically improves performance by keeping you out of choppy, range-bound conditions where crossover signals produce whipsaws.
The enhanced system: take the MA crossover signal only when ADX is above 25 and rising. If ADX is below 20 or falling, ignore all crossover signals and stay flat (in stablecoins). This single filter typically reduces the number of trades by 40-50% while improving the win rate by 8-12 percentage points, because it eliminates the whipsaw losses that plague trend-following systems during consolidation periods.
Donchian Channel Breakout (Turtle Trading)
The legendary Turtle Traders used a Donchian Channel system, buying when price broke above the 20-day high and selling when it broke below the 10-day low. This system requires zero prediction -- it simply follows price to new highs and exits when the trend weakens. In crypto, a modified version using a 20-day breakout entry and 10-day breakdown exit produces reliable trend-following returns with a clear, mechanical execution process.
The psychological challenge of Donchian Channel trading is that your entries always feel "late" (you are buying at the highest price of the last 20 days) and your exits always feel "early" (you exit before the trend is fully exhausted). This is by design. The system trades precision for robustness, and over hundreds of trades, the math works strongly in your favor because the winning trades (during strong trends) produce outsized returns that more than compensate for the frequent small losses during ranges.
Range Trading
Range trading is the art of profiting from sideways markets. When an asset oscillates between a well-defined support floor and resistance ceiling, range traders buy near support and sell near resistance repeatedly. This strategy is the natural complement to trend following: when the trend-following system is in "standby" mode due to a lack of trend, range trading generates returns from the same choppy conditions.
Crypto markets spend a surprising amount of time in ranges. Even during bull markets, major assets like Bitcoin typically trend for only 30-40% of the time, with the remaining 60-70% spent in consolidation ranges. Identifying these ranges early and trading within them can generate consistent income between the major trending moves.
Identifying Valid Ranges
Not every period of consolidation is a tradable range. A valid range requires at least three touches of both the support and resistance levels, with price respecting these boundaries consistently. The more touches without a breakout, the stronger the range is considered. Additionally, the range should be wide enough to generate meaningful profits after commissions, typically requiring at least 4-5% between support and resistance on the daily timeframe.
Volume analysis helps confirm a range. In a true range, volume typically declines as the consolidation progresses, reflecting decreasing interest and indecision. A sudden spike in volume near a range boundary often precedes a breakout, signaling that you should stop range trading and prepare for a directional move.
Range Trading Execution
Once a valid range is identified, execution follows a simple protocol. Place limit buy orders at or slightly above the support level, and limit sell orders at or slightly below the resistance level. Use a stop-loss 2-3% beyond the range boundary to protect against a genuine breakout. Scale in: place 50% of your order at the boundary touch and the remaining 50% at a level 1% beyond the boundary (in case of a brief overshoot).
Range Trading -- Risk Management Rules
- Never risk more than 1.5% of your account on a single range trade
- If the range boundary is tested more than 5 times without breaking, expect an imminent breakout
- Reduce position size by 50% after the fourth touch of either boundary
- Stop range trading if ADX rises above 25, indicating a trend is forming
- Do not add to losing range trades -- if your entry is underwater, let the stop work
Arbitrage Strategies (CEX and DEX)
Arbitrage is the simultaneous purchase and sale of the same asset on different markets to profit from price discrepancies. In theory, arbitrage is "risk-free" because you are buying and selling at the same time. In practice, crypto arbitrage involves execution risk, transfer delays, gas costs, and liquidity constraints that turn seemingly guaranteed profits into potential losses if not managed carefully.
The crypto market offers uniquely rich arbitrage opportunities because of its fragmentation: hundreds of centralized exchanges (CEXs), thousands of decentralized exchange pools (DEXs), and cross-chain bridges create an enormous number of price relationships that can temporarily diverge. While much of the easily accessible arbitrage has been captured by automated bots, there remain opportunities in areas that bots find difficult to navigate.
CEX-to-CEX Arbitrage
The simplest form of crypto arbitrage involves buying an asset on one centralized exchange where it is cheaper and simultaneously selling it on another exchange where it is more expensive. To execute this without transfer delay risk, you pre-fund both exchanges with the asset and the quote currency. When a spread appears, you buy on the cheap exchange and sell on the expensive exchange simultaneously, then rebalance later.
Typical spreads between major CEXs for high-volume pairs (BTC/USDT, ETH/USDT) are only 0.01-0.05%, which is often less than the combined trading fees. More opportunities arise on mid-cap tokens where spreads can reach 0.5-2%, and on smaller or regional exchanges that lag in price updates. The best opportunities typically appear during high-volatility events when exchange prices temporarily diverge.
DEX-to-DEX Arbitrage
DEX arbitrage exploits price differences between decentralized exchange pools. Since each AMM (Automated Market Maker) pool has its own price based on the ratio of tokens in the pool, prices across different DEXs for the same token pair can diverge when large trades shift one pool's balance. DEX aggregators like Jupiter (Solana) and 1inch (Ethereum) automatically find the best price across pools, but savvy traders can still find edges by monitoring pool ratios directly.
Cross-DEX arbitrage on Solana is particularly attractive because of the near-zero transaction costs and sub-second confirmation times. A typical flow involves monitoring price feeds from Raydium, Orca, and Meteora pools for the same token pair. When one pool deviates by more than the total round-trip fee (typically 0.3-0.6%), you can execute the arbitrage with a simple swap route.
Cross-Chain Arbitrage
Cross-chain arbitrage exploits price differences for the same token (or equivalent stablecoins) across different blockchain networks. For example, USDC might trade at slightly different effective rates on Ethereum vs. Solana due to bridge liquidity and timing. Similarly, a token listed on both Ethereum and BSC may have different prices on Uniswap and PancakeSwap.
The challenge with cross-chain arbitrage is bridge latency and fees. Bridge transfers can take minutes to hours, during which the spread may close. Bridge fees of 0.1-0.3% further reduce potential profits. To mitigate this, maintain capital on multiple chains and arbitrage the spread by buying on the cheap chain and selling on the expensive chain without actually bridging, rebalancing only periodically.
Grid Trading
Grid trading is a systematic strategy that places buy and sell orders at predetermined price intervals within a defined range, creating a "grid" of orders. Every time the price drops to a grid level, a buy order executes. When it rises to the next level, the corresponding sell order executes. This creates consistent small profits from the natural oscillation of prices within a range, without requiring you to predict direction.
Grid trading is one of the most popular automated strategies in crypto because it thrives on volatility -- the very thing that makes most other strategies difficult. The more price oscillates, the more grid orders fill, and the more profit accumulates. Major exchanges like Binance, KuCoin, and Bybit offer built-in grid trading bots, making it accessible to traders who do not want to code their own solutions.
Grid Configuration Parameters
Setting up a grid requires four key decisions: the upper limit (ceiling), the lower limit (floor), the number of grid levels, and the amount invested per grid level. The upper and lower limits define the range within which the bot operates. The number of levels determines the spacing between orders, which directly affects trade frequency and profit per trade.
Grid Trading -- Configuration Guide
A critical grid-trading risk is the "runaway" scenario where price breaks below your grid floor and keeps falling. You end up holding tokens bought at every grid level, all now underwater. To manage this risk, set your grid floor at a strong technical support level and reserve 20-30% of your capital outside the grid to cost-average in case of a breakdown. Alternatively, combine the grid with a stop-loss that cancels all remaining buy orders if price falls more than 10% below the grid floor.
Infinity Grid
An infinity grid has no upper limit, allowing it to continue profiting as price rises indefinitely. This is designed for assets you believe will trend upward over time (like Bitcoin). The bot buys at every grid level on dips and sells on bounces, but if price keeps climbing above your highest sell, the bot simply waits and profits on the way down. The geometric spacing (each level is X% above the last, rather than a fixed dollar amount) is key to making this work.
Infinity grids sacrifice some profit capture compared to a pure buy-and-hold during strong uptrends, but they generate cash flow during corrections and sideways periods. Over a full market cycle (bull and bear), a well-configured infinity grid on BTC can outperform buy-and-hold on a risk-adjusted basis.
Dollar-Cost Averaging (DCA) and Value Averaging
Dollar-Cost Averaging is the practice of investing a fixed amount of money at regular intervals regardless of price. It is the simplest and most beginner-friendly strategy in crypto, and arguably one of the most effective for long-term wealth building. By investing the same amount each period, you automatically buy more units when prices are low and fewer when prices are high, producing a lower average cost basis than trying to time the market.
DCA eliminates the psychological burden of market timing. Most traders who attempt to "buy the dip" end up either buying too early (the dip keeps dipping) or waiting too long (the recovery leaves them behind). A DCA strategy removes this stress entirely: you invest on schedule, regardless of what the market is doing, and let time and compounding work in your favor.
Basic DCA Implementation
The standard DCA approach involves choosing an investment amount (e.g., $500/month), a frequency (weekly, bi-weekly, or monthly), and a target asset (typically BTC, ETH, or a combination). Automated DCA services are available on most major exchanges, or you can set calendar reminders and execute manually.
Enhanced DCA (Volatility-Adjusted)
A smarter version of DCA adjusts the investment amount based on market conditions. When prices are below the 200-day moving average (historically cheap), you invest 2x your standard amount. When prices are above the 200-day MA but within normal range, you invest the standard amount. When prices are extended far above the 200-day MA (overheated), you invest 0.5x or pause entirely.
This enhanced DCA approach has been shown to improve returns by 15-25% compared to standard DCA over full market cycles, because it naturally increases buying during fear and decreases buying during euphoria. It requires slightly more effort than standard DCA but remains a passive strategy that anyone can implement.

Value Averaging
Value Averaging (VA) is a more aggressive variant of DCA that targets a specific portfolio growth rate rather than a fixed investment amount. Instead of investing $500 every month, you set a target for your portfolio to grow by $500 each month. If the market rises and your portfolio grows by $800, you only invest... nothing -- or even sell $300 to bring it back to the target. If the market drops and your portfolio loses $200, you invest $700 to make up the difference.
Value averaging produces better average returns than standard DCA in backtests, but it requires more capital (you need reserves for the periods when you invest more than the standard amount) and more discipline (selling during rising markets feels counterintuitive). It also generates more taxable events. For most retail investors, enhanced DCA is the better balance between optimization and simplicity.
Pairs Trading
Pairs trading is a market-neutral strategy that profits from the relative performance of two correlated assets rather than the absolute direction of the market. You go long on one asset and short on another that historically moves together. When their spread diverges beyond its normal range, you bet on convergence. The beauty of pairs trading is that it works in bull, bear, and sideways markets because you are hedged against market-wide moves.
In crypto, natural pairs include: BTC/ETH (the two largest assets that generally move together), L1 pairs (SOL/AVAX, ADA/DOT), exchange tokens (BNB/OKB), and DeFi protocol tokens within the same category (AAVE/COMP, UNI/SUSHI). The stronger the historical correlation between the pair, the more reliable the mean reversion of the spread.
Statistical Pairs Trading
The statistical approach uses z-scores of the price ratio or spread between two assets. Calculate the ratio (Asset A / Asset B), compute the rolling mean and standard deviation (typically 20-30 day lookback), and derive the z-score: (current ratio - mean) / standard deviation. When the z-score exceeds +2, short A and long B (expecting convergence). When it drops below -2, long A and short B.
Pairs Trading -- Popular Crypto Pairs and Metrics
The critical risk in pairs trading is correlation breakdown, where two previously correlated assets decouple permanently due to a fundamental shift (e.g., one protocol gets hacked, one chain launches a major upgrade). To manage this, always set a maximum loss threshold for any single pair trade (typically 5% of the position) and monitor fundamental news that could cause permanent divergence.
News and Event-Driven Trading
Event-driven trading exploits predictable or semi-predictable price reactions to specific events. In crypto, key events include exchange listings, token unlocks, protocol upgrades, partnership announcements, regulatory decisions, and macroeconomic data releases. Unlike other strategies that rely primarily on price patterns, event-driven trading incorporates fundamental catalysts and timing.
The crypto market is uniquely susceptible to event-driven moves because of its information asymmetry, 24/7 nature, and the outsized impact that social media and influencer commentary can have on prices. A single major exchange listing announcement can move a mid-cap token 20-50% in hours, while a negative regulatory headline can crash the entire market by 10% in minutes.
Exchange Listing Strategy
New listings on major exchanges (Binance, Coinbase, Kraken) are among the most predictable bullish catalysts in crypto. The "Coinbase effect" is well-documented: tokens typically pump 30-100% on the announcement of a major exchange listing. However, the listing itself often becomes a "sell the news" event, with prices declining after trading begins on the new exchange.
The strategy involves two phases: (1) Pre-listing accumulation -- identify tokens likely to be listed based on criteria that exchanges have published (team quality, regulatory compliance, community size, trading volume on smaller exchanges) and accumulate before the announcement. (2) Announcement trading -- buy immediately on the listing announcement and sell 50% within the first 2-4 hours, then trail a stop on the remaining 50%.
Token Unlock Calendar Trading
Token unlocks (vesting schedule releases) are scheduled events where previously locked tokens become available for trading. Large unlocks (more than 2% of circulating supply) typically create selling pressure as early investors and team members liquidate a portion of their newly available tokens. This creates a predictable, calendar-based trading opportunity.
The strategy: monitor token unlock calendars on sites like TokenUnlocks.app, Defillama, and CryptoRank. When a large unlock is scheduled within the next 7-14 days, evaluate whether the token has already priced in the expected selling pressure by checking if it has underperformed its peers. If not, open a short position 3-5 days before the unlock with a stop-loss above recent resistance. Cover the short 1-2 days after the unlock, as the selling pressure typically subsides within 48 hours.
Caution: Not All Unlocks Are Bearish
Some token unlocks go to ecosystem development funds, staking rewards, or community treasuries that do not immediately sell. Research the specific unlock destination before trading. Unlocks to VCs and early investors are most likely to create sell pressure, while unlocks to protocol-controlled addresses may have no immediate market impact.
FOMC and Macro Event Trading
Crypto has become increasingly correlated with traditional financial markets, particularly around Federal Reserve (FOMC) meetings and major economic data releases (CPI, employment, GDP). Bitcoin's correlation with the Nasdaq has averaged 0.6-0.8 during periods of macro uncertainty, making FOMC decisions significant events for crypto traders.
The playbook for FOMC trading: reduce all positions by 50% in the 24 hours before the announcement. After the announcement, wait for the initial volatility to subside (typically 30-60 minutes), then assess whether the decision was hawkish or dovish relative to market expectations. If dovish (rate cuts or dovish guidance), add risk. If hawkish, reduce further or short. The "initial move" right after the announcement is often the wrong direction, reversed within the first hour.
Technical Analysis Strategies In-Depth
Technical analysis (TA) is the study of historical price and volume data to identify patterns and predict future price movements. In crypto, TA is particularly useful because the market is heavily driven by speculative behavior and self-fulfilling prophecies: when enough traders watch the same levels and patterns, their collective actions make those levels significant. This section provides deep dives into the most effective TA tools and their crypto-specific applications.
Moving Average Crossovers -- Advanced Applications
Beyond the simple golden cross/death cross discussed in the trend-following section, moving average crossovers can be refined with several techniques. The "ribbon" approach uses 8-10 exponential moving averages (e.g., 8, 13, 21, 34, 55, 89 EMA) to create a visual momentum display. When all EMAs are stacked in order (shortest on top for uptrends), the trend is strong. When the ribbon begins to twist and compress, a trend change is imminent.
The Guppy Multiple Moving Average (GMMA) separates the ribbon into two groups: short-term (3, 5, 8, 10, 12, 15 EMA) and long-term (30, 35, 40, 45, 50, 60 EMA). The short-term group represents trader sentiment, while the long-term group represents investor sentiment. When the short-term group crosses above the long-term group and both groups are expanding, it signals the start of a powerful trend that has both trader and investor participation.
RSI -- Beyond Overbought/Oversold
The Relative Strength Index has several advanced applications beyond simple overbought/oversold readings. RSI divergence is one of the most powerful reversal signals in crypto: when price makes a new high but RSI makes a lower high, it signals weakening momentum and a potential reversal. Bearish divergences on the daily chart have preceded major tops in Bitcoin with remarkable consistency.
RSI range shifting is another key concept. During strong uptrends, RSI tends to oscillate between 40 and 80 rather than the traditional 30-70. During downtrends, it shifts to 20-60. Recognizing which regime you are in prevents premature "overbought" sells in a bull market (where RSI at 70 is normal, not extreme) and premature "oversold" buys in a bear market (where RSI at 30 can go much lower).
RSI Advanced Techniques
- RSI Divergence: Price vs. RSI disagreement signals potential reversal. Most reliable on 4H and daily timeframes.
- RSI Support/Resistance: RSI respects its own trendlines. A break of an RSI trendline often precedes a price trendline break.
- Failure Swings: RSI crosses above 70, pulls back without reaching 70 again, then drops below the pullback low. Strong bearish signal.
- 50-Line Crossover: RSI crossing above 50 confirms bullish momentum shift; below 50 confirms bearish. Simple but effective trend filter.
MACD -- Signal and Histogram Analysis
The Moving Average Convergence Divergence (MACD) consists of the MACD line (12 EMA minus 26 EMA), the signal line (9 EMA of the MACD line), and the histogram (MACD line minus signal line). The most common signal is the MACD line crossing the signal line, but the histogram provides earlier and often more accurate signals.
The histogram's change in direction (from growing to shrinking bars) signals momentum shift before the actual crossover. When the histogram starts shrinking after a period of expansion, it means the rate of change in momentum is declining. This "histogram reversal" typically leads the MACD crossover by 2-3 candles, giving you an earlier entry. In crypto, this technique works best on the 4H and daily charts, where it can provide 12-24 hours of advance warning before a trend change.
Bollinger Bands -- Squeeze and Walk
The Bollinger Band Squeeze has been discussed in the breakout section, but the "band walk" is equally important for trend following. During strong trends, price "walks" along the upper (uptrend) or lower (downtrend) Bollinger Band, with each pullback finding support/resistance at the middle band (20 SMA). As long as price continues to touch the outer band and bounce off the middle band, the trend remains intact.
The end of a band walk is signaled when price fails to reach the outer band after a middle-band bounce, or when it closes beyond the middle band to the opposite side. This transition from trending to ranging conditions is the point where you switch from trend-following strategies to mean-reversion or range-trading strategies.
Fibonacci Extensions and Clusters
While Fibonacci retracements identify pullback levels within a trend, Fibonacci extensions project potential targets for the next wave of the trend. The key extension levels are 1.272, 1.618, 2.0, and 2.618. In crypto bull markets, the 1.618 and 2.618 extensions frequently act as precise reversal points for Bitcoin and major altcoins.
Fibonacci clusters occur when multiple Fibonacci levels from different swing measurements converge at the same price zone. For example, if the 0.618 retracement of a larger swing and the 1.618 extension of a smaller swing both point to the same price area, this creates a high-probability support or resistance zone. These clusters are among the most powerful tools in a technical analyst's arsenal because they represent confluence from multiple perspectives.

Fundamental Analysis for Crypto
Fundamental analysis in crypto evaluates the intrinsic value of a protocol or token based on its technology, adoption metrics, financial health, competitive positioning, and growth potential. While crypto fundamentals differ significantly from traditional stock analysis (there are no earnings reports or P/E ratios in the traditional sense), a rigorous fundamental framework can identify undervalued projects before the market catches on.
The key challenge in crypto fundamental analysis is determining what constitutes "fundamentals" in a market where value is often narrative-driven. We focus on quantifiable metrics that correlate with long-term price performance: active addresses, transaction volume, developer activity, revenue (for DeFi protocols), and token economics.
On-Chain Valuation Metrics
Several on-chain ratios help assess whether a crypto asset is overvalued or undervalued relative to its usage and adoption:
Developer Activity Analysis
GitHub commit activity and developer count are strong leading indicators of a project's long-term viability. Projects with declining developer activity often see price declines 3-6 months later, as the market eventually recognizes the lack of development progress. Conversely, projects with accelerating developer activity (especially from new contributors) are more likely to deliver meaningful upgrades that drive adoption and price appreciation.
Tools like Electric Capital's Developer Report, Artemis.xyz, and GitHub directly provide developer activity metrics. Look for: total weekly commits (trend, not absolute number), unique contributors (breadth of developer interest), and code complexity metrics (not all commits are equal -- focus on commits to core protocol code rather than documentation or minor fixes).
Tokenomics Evaluation Framework
Tokenomics, the economic design of a token, is arguably the most important fundamental factor for long-term price performance. A protocol can have groundbreaking technology, but if its tokenomics are inflationary, have excessive insider allocations, or lack value-capture mechanisms, the token price will underperform.
Tokenomics Red Flags vs. Green Flags
On-Chain Analysis Strategies
On-chain analysis examines blockchain data directly to derive trading signals. Unlike technical analysis (which uses only price and volume) or fundamental analysis (which evaluates project quality), on-chain analysis reveals what market participants are actually doing with their tokens: accumulating, distributing, moving to exchanges, staking, providing liquidity, or sitting idle.
The transparency of public blockchains gives crypto traders an information advantage that does not exist in traditional markets. You can literally watch whale wallets accumulate Bitcoin, track smart-money DeFi positions, and monitor exchange inflow/outflow in real-time. This data, when properly interpreted, provides actionable leading indicators for price movements.
Exchange Flow Analysis
The flow of tokens to and from exchanges is one of the most powerful on-chain indicators. When large amounts of BTC or ETH flow into exchanges (net inflow), it suggests holders are preparing to sell, which is bearish. When tokens flow out of exchanges (net outflow), it suggests accumulation and long-term holding, which is bullish. Tools like CryptoQuant, Glassnode, and Nansen track these flows in real-time.
Key thresholds to watch: when Bitcoin exchange net flow exceeds +10,000 BTC in a single day, this has historically preceded short-term corrections. Conversely, sustained periods of negative net flow (outflows exceeding inflows) for 2+ weeks often precede rallies. The most actionable signal is a spike in exchange inflows following a period of sustained outflows, as this suggests early smart-money distribution.
Whale Wallet Tracking
Whale wallets (addresses holding large quantities of an asset) move markets. When whales accumulate, prices tend to follow. When whales distribute, declines often ensue. Services like Nansen, Arkham Intelligence, and DeBank allow you to label and track specific whale wallets, including those associated with known entities (exchanges, VCs, protocol treasuries).
The most actionable whale signal is "smart money" accumulation of mid-cap tokens that have not yet appreciated. If a wallet known to belong to a successful DeFi investor (identified through historical analysis of profitable trades) begins accumulating a token, this is a strong signal worth investigating. However, whale tracking requires nuance: not all large wallets are smart money, and some apparent "accumulation" is actually exchange hot-wallet rotation or protocol treasury management.
Supply Dynamics: HODLer Waves and Dormancy
HODL Waves visualize the age distribution of Bitcoin's UTXO set, showing what percentage of supply has moved within various time windows (1 day, 1 week, 1 month, 3 months, 6 months, 1 year, etc.). When the young coin supply (moved within 3 months) increases, it indicates active trading and potential distribution. When old coin supply (unmoved for 1+ year) increases, it indicates accumulation and conviction.
Coin dormancy measures the average age of coins moved in a transaction. A dormancy spike means that very old coins (long-term holders) are suddenly moving, which often signals a major market event -- either a cycle top (as early adopters finally sell) or a capitulation bottom (as even long-term holders give up). These spikes are rare but extremely significant: in Bitcoin's history, dormancy spikes have coincided with every major cycle peak and trough.
Pro Tip: Combining On-Chain Signals
No single on-chain metric is reliable in isolation. The most powerful approach combines multiple signals: exchange outflows + whale accumulation + declining young-coin supply = high-conviction bullish signal. Exchange inflows + whale distribution + rising dormancy = high-conviction bearish signal. Use tools like Glassnode's workbench to create composite indicators.
DeFi Yield Strategies
Decentralized Finance (DeFi) has created an entirely new category of trading strategies centered on earning yield from protocol participation. Unlike traditional trading where you profit only from price changes, DeFi allows you to earn passive income through lending, liquidity provision, staking, and yield farming -- often while also benefiting from token price appreciation. This section covers the major DeFi yield strategies and how to evaluate their risk-reward profiles.
Liquidity Provision on AMMs
Providing liquidity to Automated Market Maker pools (Uniswap, SushiSwap, Raydium, Meteora) earns you a share of the trading fees generated by the pool. When someone swaps Token A for Token B in a pool, they pay a fee (typically 0.3%) that is distributed to liquidity providers (LPs) proportionally to their share of the pool. High-volume pools can generate APYs of 20-100%+.
The main risk is impermanent loss (IL): when the price ratio of the two tokens in the pool changes significantly from when you deposited, you end up with less total value than if you had simply held the tokens. IL is most severe in volatile token pairs and least severe in correlated pairs (like stablecoin pairs or ETH/stETH). The fee income must exceed the impermanent loss for the strategy to be profitable.
Concentrated Liquidity Strategies
Uniswap V3 and similar protocols introduced concentrated liquidity, which allows LPs to specify a price range for their liquidity instead of covering the entire price curve. By concentrating liquidity in a narrow range around the current price, you earn significantly higher fees (often 5-10x more than a full-range position) but face higher impermanent loss if price moves outside your range.
The optimal strategy for concentrated liquidity depends on the pair's volatility. For stablecoin pairs, you can use very tight ranges (e.g., 0.999-1.001 for USDC/USDT) and earn outsized returns with minimal IL risk. For volatile pairs, wider ranges are safer but less capital-efficient. Active management -- adjusting your range as price moves -- maximizes returns but requires more time and gas costs.
Yield Farming and Incentive Hunting
Many DeFi protocols distribute their governance tokens to liquidity providers as additional incentives, often doubling or tripling the base fee APY. This practice, known as yield farming or liquidity mining, creates opportunities for high returns but also introduces the risk of impermanent loss compounded by token-price depreciation of the farming reward.
The optimal yield farming strategy involves: (1) Identifying protocols with legitimate utility and sustainable token economics (not just high APYs), (2) Entering farms early when incentive rates are highest but after smart contracts have been audited, (3) Regularly harvesting and selling farming rewards to lock in profits (rather than accumulating governance tokens that may decline), and (4) Having clear exit triggers (e.g., exit when APY drops below a target threshold or when TVL grows 10x, diluting your share).
Lending and Borrowing Loops
A more advanced DeFi yield strategy involves lending an asset, borrowing against it, and re-lending the borrowed asset to create a leveraged yield position. For example: deposit ETH into Aave, borrow USDC against it, swap USDC for more ETH, deposit again, and repeat. Each loop increases your effective APY but also increases your liquidation risk.
This strategy works best when the lending APY exceeds the borrowing rate (sometimes subsidized by protocol incentives) or when you are bullish on the collateral asset and want leveraged exposure. The key risk metric is health factor: the ratio of your collateral value to your borrowing. Most protocols liquidate your position when the health factor drops below 1.0, and a safe target is to maintain a health factor above 1.5 (or even 2.0 for volatile assets). Monitor this continuously or set up alerts.
DeFi Yield -- Critical Safety Rules
- Never invest more than 10% of your portfolio in any single DeFi protocol
- Verify smart contract audits from reputable firms (Trail of Bits, OpenZeppelin, Certik) before depositing
- Understand what you are earning: real yield from fees vs. inflationary yield from token emissions
- Set up DeBank or Zapper alerts for health factor changes on leveraged positions
- Keep a reserve of stablecoins outside DeFi for emergencies and buying opportunities
Risk Management: The Foundation of All Strategies
Risk management is not one strategy among many. It is the foundation that determines whether any strategy survives long enough to be profitable. A mediocre strategy with excellent risk management will outperform a brilliant strategy with poor risk management every single time. This section covers the essential risk management frameworks that should be applied regardless of which trading strategy you use.
The single most important concept in risk management is this: your primary job as a trader is to survive. Capital preservation comes before capital growth. If you lose 50% of your account, you need a 100% return just to break even. If you lose 90%, you need a 900% return. The math of losses is brutally asymmetric, which is why the best traders focus obsessively on limiting downside rather than maximizing upside.
Position Sizing Methods
Position sizing determines how much of your capital to allocate to each trade. It is the single most impactful decision you make, more important than entry or exit timing. The three main position-sizing approaches are fixed percentage, volatility-based, and Kelly criterion.
Fixed Percentage Risk
The simplest and most widely recommended approach: never risk more than X% of your total account on any single trade. Most professionals use 1-2% per trade. This means if your account is $10,000 and you risk 1% per trade, your maximum loss on any trade is $100. Your position size is then calculated based on the distance to your stop-loss.
Position Size Calculator
Formula: Position Size = (Account Balance x Risk %) / (Entry Price - Stop Loss Price)
Example: $10,000 account, 1% risk, BTC entry at $60,000, stop at $58,000
Position Size = ($10,000 x 0.01) / ($60,000 - $58,000) = $100 / $2,000 = 0.05 BTC ($3,000 position)
Result: If stopped out, you lose exactly $100 (1% of account). This allows 20+ consecutive losses before your account drops significantly.
Volatility-Based Position Sizing (ATR Method)
This approach adjusts position size based on an asset's current volatility, measured by the Average True Range (ATR). More volatile assets get smaller positions; less volatile assets get larger positions. The formula normalizes risk across different assets, so a BTC trade and an altcoin trade have approximately the same dollar risk despite vastly different volatility profiles.
Position Size = (Account x Risk %) / (N x ATR), where N is the number of ATRs for your stop distance (typically 2-3). If BTC has a 14-day ATR of $2,500 and you use a 2-ATR stop, your stop distance is $5,000. With a $10,000 account and 1% risk: Position = ($10,000 x 0.01) / $5,000 = 0.02 BTC. For an altcoin with an ATR representing 8% of price, the position would be proportionally smaller, equalizing the risk.
Kelly Criterion
The Kelly Criterion is a mathematical formula that calculates the optimal bet size to maximize long-term growth rate given a known win rate and payoff ratio. The formula is: Kelly % = W - [(1-W) / R], where W is your win rate and R is your average win/loss ratio.
For example, if your strategy wins 55% of the time with an average win of $200 and average loss of $150, the Kelly fraction is: 0.55 - [(1 - 0.55) / (200/150)] = 0.55 - (0.45 / 1.33) = 0.55 - 0.338 = 0.212 or 21.2%. However, most traders use "half Kelly" or "quarter Kelly" (5-10%) to reduce the volatility of their equity curve. Full Kelly produces the highest theoretical growth but with stomach-churning drawdowns that most humans cannot tolerate.
Maximum Drawdown Management
Maximum drawdown is the largest peak-to-trough decline in your portfolio value. It is the most important risk metric for evaluating a trading strategy because it determines whether you can psychologically survive a losing streak. A strategy with 80% annual returns but 60% maximum drawdown sounds great on paper but will cause most traders to abandon it (and lock in the loss) during the drawdown.
Implement a circuit-breaker rule: if your account drops by more than a predefined percentage (typically 10-15% from peak), reduce all position sizes by 50% and conduct a thorough review of recent trades. If the drawdown reaches 20%, stop trading entirely for a minimum of one week and review your strategy with fresh eyes. This prevents the catastrophic scenario where a losing trader "revenge trades" their way to a blown account.
Drawdown Recovery Reference
Correlation and Portfolio Risk
Diversification only works when your assets are not all correlated. In crypto, most tokens are highly correlated with Bitcoin during market-wide sell-offs, which means holding 10 different altcoins provides far less diversification than you might think. True diversification in crypto requires including uncorrelated assets like stablecoins, staked positions, DeFi yield strategies, and potentially non-crypto assets.
Measure the correlation between your positions using the Pearson correlation coefficient. If any two positions have a correlation above 0.80, treat them as a single position for risk management purposes. For example, if you hold both SOL and AVAX (correlation ~0.78), your effective risk exposure to "L1 altcoins" is the sum of both positions, not each individually. Adjust position sizes accordingly to prevent overconcentration in correlated assets.
Portfolio Construction
Portfolio construction is the process of combining multiple assets and strategies into a cohesive whole that achieves your desired risk-return profile. While individual strategies may perform well in isolation, combining them thoughtfully can reduce overall portfolio volatility, smooth the equity curve, and improve risk-adjusted returns through diversification across strategies, timeframes, and market conditions.
Core-Satellite Framework
The core-satellite approach divides your portfolio into two components. The "core" (60-80% of capital) consists of low-maintenance, long-term holdings: Bitcoin, Ethereum, and perhaps a few high-conviction Layer 1 tokens held as position trades or DCA accumulations. The "satellite" (20-40%) is actively traded capital allocated to shorter-term strategies: swing trading, day trading, DeFi yield farming, or arbitrage.
This framework solves a common dilemma: you want the long-term growth potential of holding crypto through bull cycles, but you also want to actively trade and generate shorter-term returns. By separating the two, you prevent the psychological trap of selling your long-term holdings during a dip because your short-term trading is going poorly.
Sample Portfolio Allocations by Risk Profile
Rebalancing Strategies
Rebalancing restores your portfolio to its target allocation after market movements cause drift. If Bitcoin rallies and your BTC allocation grows from 30% to 45%, rebalancing involves selling some BTC and buying underweight assets. This systematically sells winners (taking profit) and buys losers (buying dips), which is psychologically difficult but mathematically optimal for risk management.
Three common rebalancing approaches: (1) Calendar-based: rebalance on a fixed schedule (monthly or quarterly). Simple but may miss optimal timing. (2) Threshold-based: rebalance whenever any allocation drifts more than 5-10% from target. More responsive but requires monitoring. (3) Hybrid: check on a monthly schedule but only rebalance if drift exceeds 5%. This is the most practical approach for most traders.
Backtesting Your Strategies
Backtesting is the process of applying a trading strategy to historical data to evaluate how it would have performed. It is an essential step before risking real capital on any strategy. A backtest reveals a strategy's historical win rate, average return, maximum drawdown, Sharpe ratio, and other key metrics that help you decide whether the strategy is worth trading live.
However, backtesting is fraught with pitfalls that can produce misleadingly optimistic results. Overfitting, lookahead bias, survivorship bias, and insufficient data are common problems that cause strategies to perform beautifully in backtests but fail in live trading. Understanding these pitfalls is as important as the backtesting process itself.
Backtesting Frameworks and Tools
Avoiding Backtesting Pitfalls
Critical Backtesting Errors to Avoid
- Overfitting: Adding too many parameters to fit historical data perfectly. A strategy with 10+ parameters will almost certainly fail live. Keep it simple: 3-5 parameters maximum.
- Lookahead Bias: Using information that would not have been available at the time of the trade. Ensure your backtest only uses data that was available before each trade decision.
- Survivorship Bias: Only testing on tokens that still exist today. Many tokens that existed in 2020 are now worthless. Include delisted tokens in your dataset.
- Ignoring Transaction Costs: Even small fees compound over hundreds of trades. Always include realistic commissions, slippage (0.05-0.1%), and funding rates for perpetuals.
- Insufficient Sample Size: A strategy that produced 15 trades over 5 years has insufficient data for statistical significance. Aim for 100+ trades minimum.
Walk-Forward Optimization
Walk-forward optimization is the gold standard for strategy validation. Instead of optimizing parameters over the entire historical period (which leads to overfitting), you divide the data into segments. Optimize on the first segment (in-sample), test on the next segment (out-of-sample), then roll forward and repeat. If the strategy performs consistently across all out-of-sample segments, it is likely robust.
A practical walk-forward approach for crypto: use 6-month in-sample windows and 2-month out-of-sample windows, rolling forward by 2 months each time. This gives you a series of out-of-sample results that collectively represent how the strategy would have performed in real time. Only proceed to live trading if the out-of-sample performance is at least 60% of the in-sample performance (a metric called the "walk-forward efficiency ratio").
Trading Psychology
Trading psychology is the most underrated edge in crypto markets. Strategies are freely available in books, courses, and articles like this one. The difference between consistently profitable traders and everyone else is almost entirely psychological: the ability to follow rules under pressure, accept losses gracefully, and maintain discipline during winning and losing streaks.
The crypto market amplifies every psychological weakness. Its 24/7 nature prevents you from ever fully disconnecting. Its extreme volatility triggers fight-or-flight responses that override rational thinking. Its social media ecosystem creates constant FOMO, FUD, and peer pressure. Mastering your psychology is not optional. It is a requirement for survival.
The Big Three Psychological Traps
1. Fear of Missing Out (FOMO)
FOMO drives traders to enter positions late, chase pumps, and buy at local tops. When you see a token up 100% and feel the urge to buy immediately, that is FOMO. The antidote is a pre-written trading plan that specifies exactly which setups you will trade. If a move does not match any of your predefined setups, you do not trade it. Period. There will always be another opportunity.
2. Loss Aversion
Behavioral economics shows that humans feel the pain of a loss approximately 2.5x more intensely than the pleasure of an equivalent gain. This causes traders to hold losing positions too long (hoping for a recovery) and exit winning positions too early (locking in the pleasure before it disappears). The solution is mechanical stop-losses and profit targets set before entering the trade. Once set, do not adjust them based on emotions.
3. Revenge Trading
After a significant loss, the urge to "make it back" immediately is overwhelming. Revenge trading leads to oversized positions, abandoned risk rules, and often catastrophic losses. Implement a mandatory cooling-off period: after any loss exceeding 3% of your account, do not trade for at least 4 hours. After a loss exceeding 5%, stop trading for the day. This simple rule prevents the downward spiral that blows up more accounts than any bad strategy.
Building a Trading Routine
Professional traders thrive on routine. A consistent daily and weekly routine removes decision fatigue and creates the mental framework for disciplined execution. Here is a sample routine used by successful crypto swing traders:
The Trading Journal
A trading journal is your most powerful tool for improvement. Record every trade with: entry price, exit price, position size, strategy used, the setup that triggered the trade, your emotional state at entry and exit, and a screenshot of the chart at entry. Review your journal weekly to identify patterns in your behavior: are you consistently exiting winners too early? Are your losses concentrated on a specific day or time? Do your emotions degrade your decision-making after a certain number of hours trading?
Many traders skip journaling because it feels tedious. Those same traders wonder why they are not improving after years of trading. The traders who commit to detailed journaling for six months invariably discover actionable insights about their own psychology that no book or course could provide. Tools like Tradervue, Edgewonk, and even a simple spreadsheet can serve as your trading journal.
Platform Comparison for Different Strategies
Choosing the right trading platform is a strategic decision that directly impacts your execution quality, available tools, fee structure, and safety. Different strategies have different platform requirements: a scalper needs low latency and tight spreads, a DeFi yield farmer needs access to multiple chains, and a swing trader needs robust charting tools. This section matches strategies to optimal platforms.
Pro Tip: Fee Optimization
Fees compound significantly over time. A 0.1% fee difference on 100 trades per month with $5,000 average position size costs you $6,000 per year. Always use limit orders (maker fees are lower), look for fee rebate programs, and consider using exchange tokens (like BNB on Binance) for fee discounts. For high-frequency strategies, negotiate VIP tiers or consider exchanges with zero-fee maker programs.
Common Mistakes and How to Avoid Them
Even armed with all the strategies in this guide, most new traders make predictable mistakes that erode their capital. This section catalogs the 15 most destructive mistakes and provides concrete solutions for each. If you can avoid these pitfalls, you will be ahead of 80% of retail traders before you even make your first trade.
The #1 Rule of Trading
If there is a single piece of advice that encapsulates everything in this guide, it is this: protect your capital above all else. You can recover from a 10% drawdown. You can recover from a bad trade. You cannot recover from a blown account. Every decision you make should pass through the filter: "Does this protect my capital first and grow it second?"
Putting It All Together: Your Action Plan
This guide has covered over 25 distinct trading strategies, dozens of tools and indicators, and comprehensive frameworks for risk management, portfolio construction, and trading psychology. The sheer volume of information can feel overwhelming, so let us distill it into a practical action plan that you can start implementing today.
Week 1 -- 2: Foundation
- Choose ONE strategy that matches your timeframe and personality
- Set up your charting platform (TradingView recommended) with the required indicators
- Create a trading plan document with exact entry, exit, and position sizing rules
- Open a paper trading account and start logging simulated trades
Week 3 -- 4: Paper Trading
- Execute your strategy on paper for at least 20-30 trades
- Journal every trade including your emotional state
- Review your results: is the win rate and risk-reward in line with expectations?
- Identify any rules you are struggling to follow and address the root cause
Month 2: Small Live Trading
- Start trading with real capital, but at 25% of your intended position size
- Focus on execution quality, not profits
- Continue journaling and weekly reviews
- If profitable after 30+ live trades, gradually increase position size to 50%, then 100%
Month 3+: Optimization and Expansion
- Analyze your journal for patterns and refine your strategy
- Consider adding a second complementary strategy (e.g., swing trading + DCA)
- Implement the portfolio construction framework
- Explore DeFi yield opportunities with a small allocation
- Continue learning: read every section of this guide at least once
Remember: trading is a marathon, not a sprint. The traders who succeed long-term are not the ones with the fanciest strategies or the biggest starting capital. They are the ones who combine a sound strategy with rigorous risk management, continuous learning, and the psychological resilience to stay disciplined through the inevitable ups and downs. You now have all the tools you need. The rest is up to you.
Good luck, and trade safely.
Related Guides
- Crypto Order Types: The Complete 2026 Guide to Every Order Type in Trading
- Swing Trading Crypto for Beginners: Multi-Day Setups and Risk Rules (2026)
- When Not to Trade: 12 Red Flags Every DeFi Trader Should Know
- Top 5 Crypto Wallets in 2026: Best Wallets for Every Trader
- How to Avoid Rug Pulls on Solana: Red Flags Every Trader Should Know
Frequently Asked Questions
What are common crypto trading strategies for beginners?
Beginner-friendly strategies include dollar-cost averaging, swing trading, and trend following, which require less constant monitoring than day trading. Each strategy suits a different time commitment and risk tolerance.
What is the difference between day trading and swing trading?
Day trading involves opening and closing positions within the same day to capture short-term moves, while swing trading holds positions for days or weeks to capture larger trends. Day trading demands more time and discipline.
Why is risk management important in crypto trading?
Crypto markets are highly volatile, so risk management tools like position sizing and stop-losses help limit losses on any single trade. Protecting capital is often more important than chasing large gains.
What is dollar-cost averaging in crypto?
Dollar-cost averaging means investing a fixed amount at regular intervals regardless of price, which smooths out the average entry cost over time. It reduces the impact of trying to time volatile markets.