The First 72 Hours of a Token Launch: How to Spot Real Survival Signals After the Hype
— By Whatsertrade in Tutorials
The first 72 hours of a token launch can be the most revealing period in its entire market life. A new token can attract attention quickly, move fast on the cha
The first 72 hours of a token launch can be the most revealing period in its entire market life. A new token can attract attention quickly, move fast on the chart, and generate strong social activity, but early hype is not the same as long term survival. For traders, analysts, and project teams, the real question is not whether a token can pump in the first hour. The real question is whether it can hold attention, liquidity, volume, and confidence after the initial wave.
This is where DEXTools becomes essential. By combining price action, liquidity data, holder behavior, transaction activity, and pair information, traders can build a clearer picture of whether a new token is building a real market or simply burning through early excitement.
Why the First 72 Hours Matter
Most new tokens face their first serious test almost immediately. The launch brings in early buyers, snipers, bots, insiders, community members, and speculative traders. During the first few minutes, price movements can be extreme and difficult to interpret. After the first wave, the market begins to show more useful signals.
The first 72 hours reveal whether buyers continue to arrive after the launch event. They also show whether liquidity remains stable, whether early wallets are distributing, whether volume fades too quickly, and whether the token can develop a healthier trading rhythm. A strong launch without follow through often leads to a weak chart. A slower launch with consistent accumulation can sometimes be more interesting than an explosive first candle.
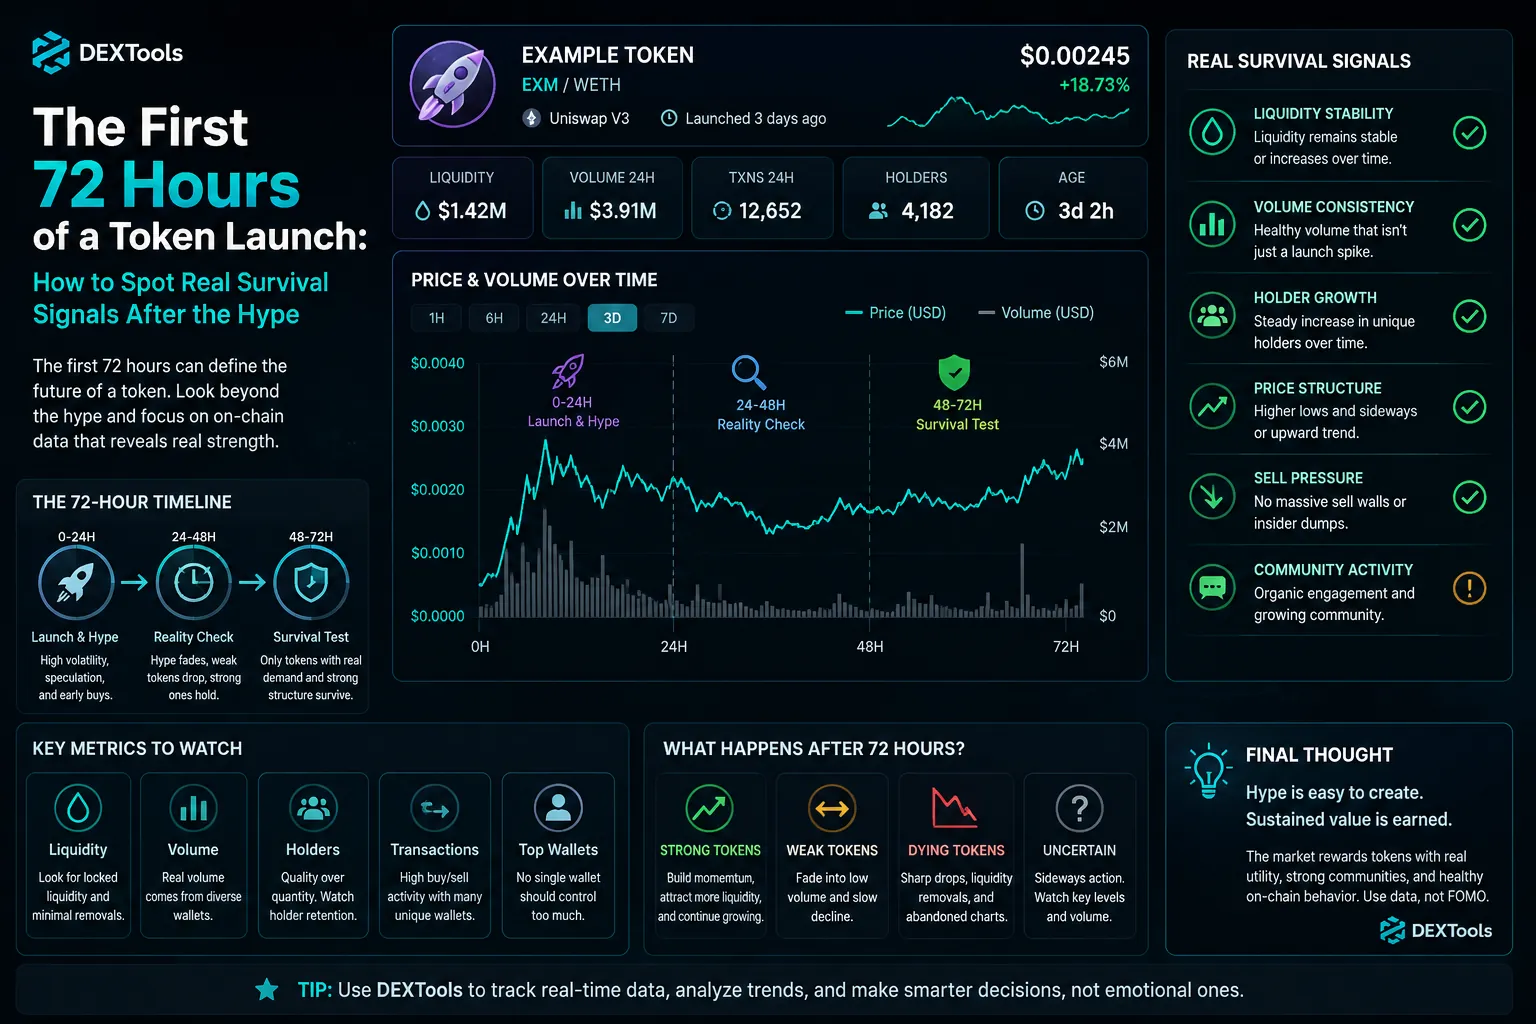
Signal 1: Volume That Does Not Collapse After the First Wave
One of the first survival signals to watch is volume retention. Many new tokens experience a large volume spike at launch, followed by a sharp decline. This is normal to some extent, but the size and speed of the drop matter.
A healthier token often shows a gradual cooling period rather than a complete disappearance of activity. If volume remains present across several sessions, it may indicate that traders are still watching, entering, exiting, and reassessing the token. Consistent volume does not guarantee success, but it suggests that the market has not abandoned the pair.
On DEXTools, traders can monitor whether volume is concentrated in one short window or spread across the first day, second day, and third day. A token that only moves during the first minutes may be driven mainly by launch mechanics. A token that keeps generating trades across several days may deserve closer observation.
Signal 2: Liquidity That Stays in Place
Liquidity is one of the strongest indicators of market confidence. A token can have an attractive chart, but if liquidity is unstable, trading risk increases. During the first 72 hours, traders should watch whether liquidity grows, remains steady, or begins to disappear.
Stable liquidity gives traders more confidence that the market can support entries and exits. Rising liquidity may show that the team or community is reinforcing the market. Falling liquidity can be a warning sign, especially if it happens while price action remains promotional or social activity is still aggressive.
The key is to compare liquidity behavior with price movement. If price rises while liquidity becomes thinner, the chart may look better than the market actually is. If liquidity remains strong during pullbacks, it may suggest that the market has more structure.
Signal 3: Holder Growth With Real Distribution
Holder count is often misunderstood. A growing holder count can be positive, but only if the growth appears meaningful. A token with many tiny wallets may look distributed on the surface while still being controlled by a small number of larger wallets.
During the first 72 hours, traders should watch whether holder growth is organic and whether the distribution becomes healthier over time. If new holders keep appearing while no single wallet dominates the market, the token may be building a broader base. If most supply remains concentrated or if early wallets start selling into every new wave of buyers, the risk profile changes.
A strong holder base does not simply mean more wallets. It means better balance, more independent participation, and less dependence on a few actors.
Signal 4: Price Recovery After the First Pullback
Every new token faces profit taking. The question is how the market reacts after the first meaningful pullback. A token that drops and never regains activity may have been driven mostly by launch excitement. A token that forms a base, attracts new buyers, and shows renewed volume after a correction may be showing early resilience.
Traders should avoid judging a token only by its first green candle. The second and third market reactions are often more informative. Does the token recover with real volume, or does it bounce weakly on low activity? Do buyers step in at logical areas, or does each bounce get sold immediately?
The first recovery attempt can reveal whether traders still believe in the token after early profits have been taken.
Signal 5: Social Attention That Matches Market Behavior
Social activity can help a token grow, but it can also distort perception. A token may appear popular because of paid posts, influencer calls, or coordinated promotion. During the first 72 hours, traders should compare social attention with market behavior.
If the token is trending socially but volume is fading, liquidity is shrinking, and holders are not growing meaningfully, the attention may not be translating into real demand. If social interest rises while the chart shows consistent volume and stable liquidity, the signal becomes more credible.
A healthy launch does not need constant noise. It needs attention that turns into participation.
Signal 6: Fewer Violent Swings Over Time
Extreme volatility is normal during launch, but the market should begin to show some structure after the initial phase. If each candle becomes more chaotic and liquidity remains thin, the token may be difficult to trade responsibly. If volatility begins to settle while volume remains active, the token may be entering a more mature early stage.
This does not mean the token must become calm. New tokens are naturally risky. The goal is to identify whether the market is becoming more readable. A chart that starts to respect levels, consolidate, and recover from pullbacks is often more useful than a chart that only moves through sudden spikes.
How to Build a 72 Hour Token Review With DEXTools
A practical review should begin with the token pair page. Traders can check price action, volume, liquidity, transactions, pair age, and related market data in one place. The first step is to separate launch noise from continuing activity.
Look at whether the token still has active trades after the first rush. Compare volume across different periods. Check whether liquidity is still present. Review whether the token has more than one relevant pool. Watch holder growth and transaction patterns. Then connect the data with the broader narrative around the token.
The goal is not to predict the future with certainty. The goal is to avoid being blinded by the first candle.
Common Mistakes Traders Make in the First 72 Hours
Many traders buy too quickly because they fear missing the first move. Others ignore liquidity and focus only on price. Some assume that a high holder count automatically means safety. Others trust social activity without checking whether it is reflected in real market data.
The biggest mistake is treating a launch as a final verdict. The first 72 hours are not about proving that a token will succeed forever. They are about identifying whether the token deserves continued attention.
Conclusion
The first 72 hours of a token launch are a stress test. A strong token does not only attract buyers at launch. It keeps enough interest, liquidity, volume, and holder growth to survive after the initial excitement fades.
DEXTools helps traders move beyond hype by giving them the market data they need to evaluate new tokens more carefully. By watching volume retention, liquidity stability, holder quality, recovery after pullbacks, and the relationship between social attention and actual trading activity, traders can make better decisions in one of the most volatile areas of crypto.
A new token does not need to be perfect in its first three days. But it does need to show signs that the market is still alive after the launch noise is gone.
How to Bridge Crypto Between Chains: Complete Cross-Chain Tutorial 2026 How to Use 1inch for Swaps: Classic, Fusion and Limit Orders (2026) How to Use OKX Web3 Wallet: Multi-Chain DeFi Hub Guide (2026)Beyond the Candlesticks: Deciphering the On-Chain Narrative
While price action and trading volume offer crucial initial insights, a truly deep-dive analysis into a token's post-launch survival signals demands a venture into the on-chain data. The blockchain is an immutable ledger, recording every transaction, every wallet interaction, and every contract call. This raw data, when properly interpreted, reveals the underlying mechanics and genuine user engagement that price charts alone cannot fully articulate.
Understanding the on-chain narrative helps differentiate between speculative pumps driven by a few large wallets and organic growth fueled by a widening base of committed participants. It's about looking past the immediate market noise to see the fundamental activity, or lack thereof, underpinning the token's early days.
The Anatomy of Early On-Chain Health
- Unique Holder Growth: Track the number of unique wallets holding the token. A steady increase, rather than stagnation or decline, suggests broadening distribution and new interest.
- Transaction Count and Velocity: Monitor the total number of transactions and the frequency with which the token is being moved. High transaction velocity among many wallets indicates active use or trading.
- Distribution Skew: Analyze the concentration of token holdings. A highly centralized distribution, where a few wallets hold the vast majority, is a red flag for potential manipulation. Look for a gradual decentralization.
- Liquidity Pool Depth and Stability: Evaluate the growth and stability of the token's liquidity pools. Deep, balanced pools with minimal impermanent loss indicate healthy market support and confidence.
- Smart Contract Interactions: For utility tokens, observe interactions with associated dApps or staking contracts. Genuine engagement here signals real-world utility and adoption beyond mere trading.
Related Guides
- The First 60 Minutes After a Token Launch: What to Watch on DEXTools
- Spot Real Demand vs Hype: On-Chain Metrics Guide
- Token Analysis: First 48 Hours Checklist (2026 Sniper Guide)
- The Life Cycle of a Memecoin: Launch to Survival or Fade
- The First 30 Minutes After a Token Starts Trending: A DeFi Trader’s Playbook
Frequently Asked Questions
How can I tell if a token has real potential beyond initial hype?
Look for sustained trading volume and a diversifying holder base beyond the initial buyers. A healthy token shows signs of organic interest and adoption, not just speculative trading. Check for active community engagement and developer updates.
What are key indicators of a token's health in the first 72 hours?
Monitor the distribution of tokens among holders; a broad distribution is generally healthier than concentration in a few wallets. Analyze the liquidity pool's depth and stability, as well as the absence of significant, rapid dumps by large holders. Consistent transaction activity, not just price pumps, is a good sign.
What red flags should I watch out for during a token's launch?
Be wary of extreme price volatility without underlying news, very low liquidity, or a significant portion of tokens held by a few wallets (whale concentration). Also, look out for sudden, large sell-offs by developers or early investors, which can indicate a rug pull or lack of long-term commitment. Unresponsive or non-existent community channels are also a concern.
Where can I find reliable information to assess a new token?
Utilize blockchain explorers (like Etherscan, BSCScan) to analyze on-chain data like token distribution, transaction history, and liquidity. Join official community channels (Telegram, Discord) to gauge developer activity and community sentiment. Always cross-reference information from multiple reputable sources and avoid relying solely on social media hype.