How to Read Crypto Charts: Beginner's Tutorial (2026)
— By Tony Rabbit in Tutorials
Learn how to read crypto charts step by step: candlesticks, trends, support, resistance and volume. A beginner tutorial to start trading with confidence.
If you want to go beyond the basics of crypto charts, the two most relevant next reads are EMA vs SMA in Crypto for moving-average structure and What Is Ichimoku Cloud in Crypto? for a full trend system.
Understanding how to read cryptocurrency charts is one of the most valuable skills a trader can develop. Whether you are looking at Bitcoin, Ethereum, or a new memecoin on a DEX, the charts tell a story about what buyers and sellers are doing in real time.
This beginner-friendly tutorial will teach you everything you need to know about reading crypto charts, from basic candlestick patterns to key technical indicators and how to use them for smarter trading decisions.
Need the full visual pattern library? Use our candlestick patterns cheat sheet for the 35+ pattern reference page. This tutorial stays focused on the broader beginner skill of reading crypto charts.
What Is a Crypto Price Chart?
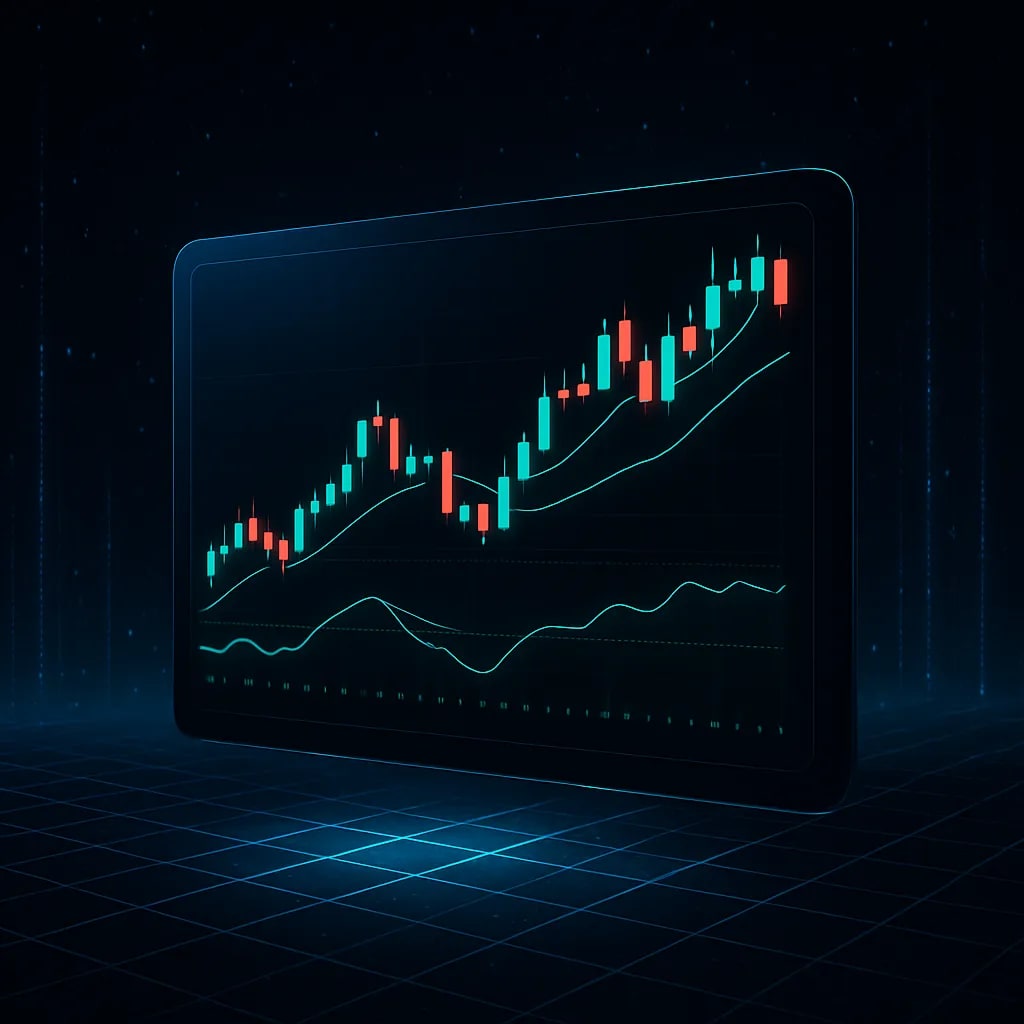
A crypto price chart is a visual representation of a token's price movement over time. Charts plot price on the vertical axis (Y) and time on the horizontal axis (X). They help traders identify trends, support and resistance levels, and potential entry or exit points.
Most crypto charts use Japanese candlesticks, a charting method invented in 18th-century Japan for rice trading that remains the gold standard for financial analysis today.

How to Read a Candlestick
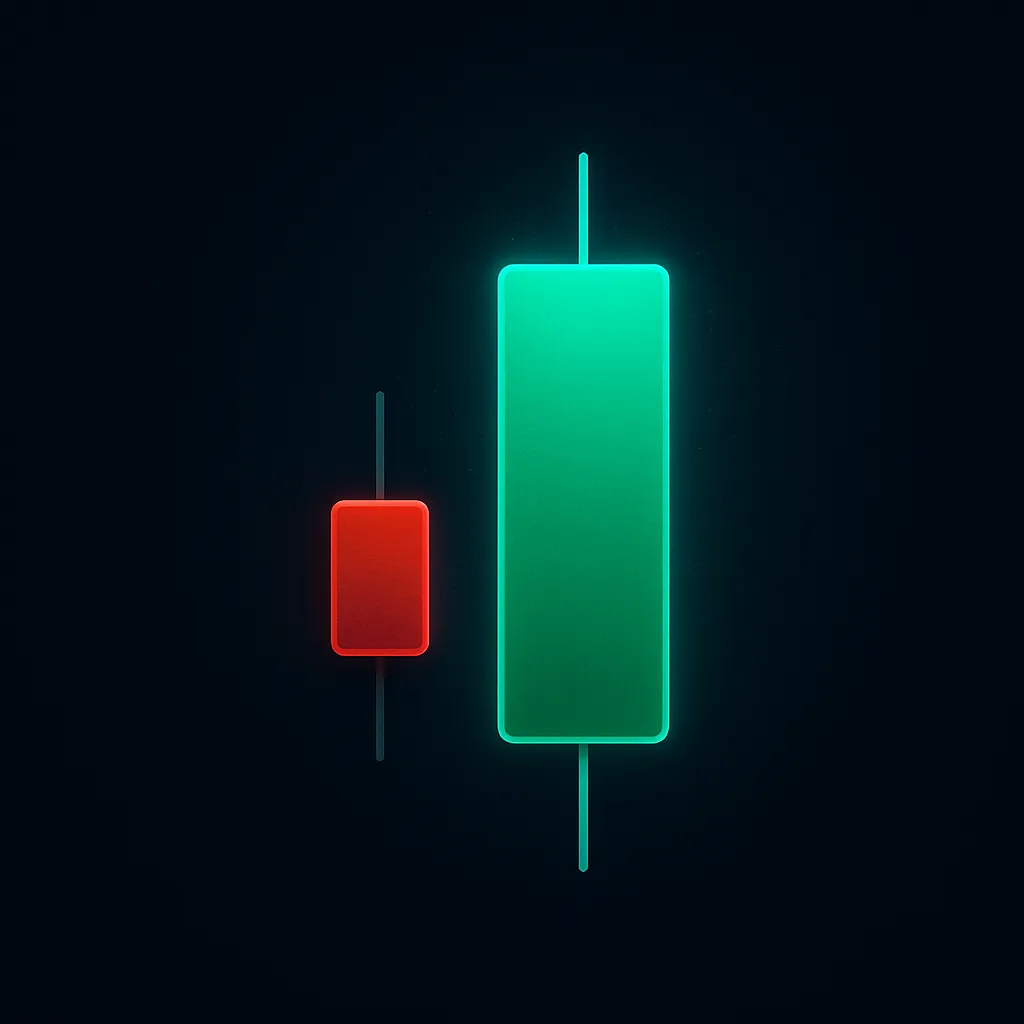
Each candlestick represents a specific time period (1 minute, 1 hour, 1 day, etc.) and shows four data points:
- Open: The price at the beginning of the time period
- Close: The price at the end of the time period
- High: The highest price reached during the period
- Low: The lowest price reached during the period

Green vs Red Candles
- Green (bullish) candle: The close price is higher than the open. Buyers dominated this period.

- Red (bearish) candle: The close price is lower than the open. Sellers dominated this period.
The thick part of the candle is called the body. The thin lines above and below are called wicks (or shadows). Long wicks indicate price rejection at those levels.
Essential Candlestick Patterns Every Trader Should Know
Single Candle Patterns
- Doji: Open and close are nearly the same price, forming a cross shape. Signals indecision and a potential trend reversal.

- Hammer: Small body at the top with a long lower wick. Appears in downtrends and signals a potential bullish reversal.

- Shooting Star: Small body at the bottom with a long upper wick. Appears in uptrends and signals a potential bearish reversal.

- Marubozu: A candle with almost no wicks, showing strong conviction in one direction.

Multi-Candle Patterns
- Engulfing Pattern: A large candle completely "engulfs" the previous candle. Bullish engulfing (green engulfs red) signals reversal upward. Bearish engulfing (red engulfs green) signals reversal downward.
- Morning Star / Evening Star: Three-candle reversal patterns. Morning star (bearish, doji, bullish) signals bottom. Evening star (bullish, doji, bearish) signals top.

- Three White Soldiers / Three Black Crows: Three consecutive strong candles in the same direction, confirming trend strength.

Understanding Timeframes
The timeframe you choose changes how the chart looks and what it tells you:
| Timeframe | Best For | Trading Style |
|---|---|---|
| 1m / 5m | Scalping, sniping new tokens | Very short-term |
| 15m / 1h | Day trading | Short-term |
| 4h / 1d | Swing trading | Medium-term |
| 1w / 1M | Long-term investing | Position trading |
Pro tip: Always check multiple timeframes. A token might look bullish on the 5-minute chart but bearish on the daily. The higher timeframe usually has more weight.
Key Technical Indicators for Crypto
1. Moving Averages (MA)
Moving averages smooth out price data to show the overall trend direction. The two most common types:
- SMA (Simple Moving Average): The average closing price over a set number of periods. Common settings: SMA 20, SMA 50, SMA 200.

- EMA (Exponential Moving Average): Gives more weight to recent prices, making it more responsive to current action.
Key signal: When the shorter MA crosses above the longer MA, it is called a "golden cross" (bullish). When it crosses below, it is called a "death cross" (bearish).
2. RSI (Relative Strength Index)
RSI measures how overbought or oversold a token is on a scale of 0 to 100:
- Above 70: Overbought - the price may be due for a pullback

- Below 30: Oversold - the price may be due for a bounce
- Divergence: When price makes new highs but RSI does not, it signals weakening momentum
3. Volume
Volume shows how many tokens were traded during a period. It is one of the most important indicators for validating price moves:
- Rising price + rising volume: Strong move, likely to continue

- Rising price + falling volume: Weak move, potential reversal ahead
- Volume spikes: Often occur at turning points (tops and bottoms)
4. Bollinger Bands
Bollinger Bands create a channel around the price using a moving average and standard deviations:
- Price touching the upper band suggests overbought conditions
- Price touching the lower band suggests oversold conditions
- Squeeze (bands narrowing) signals a big move is coming

5. MACD (Moving Average Convergence Divergence)
MACD tracks the relationship between two moving averages:
- MACD line crossing above signal line: Bullish signal

- MACD line crossing below signal line: Bearish signal
- Histogram: Shows the strength of the current momentum
Support and Resistance Levels
These are price levels where buying or selling pressure historically concentrates:
- Support: A price level where buyers consistently step in, preventing further decline. Think of it as a floor.

- Resistance: A price level where sellers consistently appear, preventing further rise. Think of it as a ceiling.
- Flip: When a resistance level breaks and becomes support (or vice versa), it confirms a trend change.
On DEXTools charts, you can draw support and resistance lines directly on the price chart to track these levels visually.
Chart Patterns That Signal Big Moves
Continuation Patterns
- Bull Flag: A sharp rise followed by a slight downward channel. Usually breaks upward.

- Ascending Triangle: Flat resistance with rising support. Typically breaks upward.

- Cup and Handle:
 A rounded bottom followed by a slight pullback. Signals continuation of an uptrend.
Reversal Patterns
- Head and Shoulders:
 Three peaks where the middle is highest. Signals trend reversal from bullish to bearish.
 - Double Top / Double Bottom:
 Price tests the same level twice and reverses. Double top is bearish, double bottom is bullish.
 - Wedge:
 Converging trendlines. Rising wedge is bearish, falling wedge is bullish.
Reading Charts on DEX Tokens
DEX tokens have unique chart characteristics compared to centralized exchange tokens:
- Lower liquidity: Charts may show larger wicks and more volatile moves. Analyze liquidity before drawing conclusions from the chart.
- Whale impact: Single large buys or sells can create dramatic candles. Use whale tracking alongside chart analysis.
- Bot activity: MEV bots and snipers can create artificial patterns in the first minutes of a token's life.
- Bonding curves: Tokens launched on platforms like Pump.fun follow mathematical bonding curves rather than traditional order books.
DEXTools provides advanced charting with all major indicators across multiple blockchains including Ethereum, Solana, BSC, Base, and Arbitrum.
Putting It All Together: A Practical Example
Here is how a professional trader reads a chart step by step:
- Check the daily chart first to identify the overall trend (up, down, or sideways)
- Mark key support and resistance levels on the daily and 4-hour charts
- Check RSI to see if the token is overbought or oversold
- Look at volume to confirm whether recent moves are backed by real trading activity
- Switch to lower timeframes (1h, 15m) to find precise entry points near support
- Set alerts using DEXTools alerts for price levels and volume changes
- Cross-reference with on-chain data like holder distribution and wallet activity
Common Beginner Mistakes
- Only using one timeframe: Always check higher timeframes for context
- Ignoring volume: Price without volume is meaningless. A breakout on low volume usually fails.
- Overcomplicating with indicators: Start with candlesticks, volume, and one or two indicators. More is not better.
- Trading against the trend: "The trend is your friend." Fighting a strong trend is the fastest way to lose money.
- Confusing patterns with predictions: Patterns show probability, not certainty. Always use proper research alongside chart analysis.
Frequently Asked Questions
What is the best chart type for crypto trading?
Japanese candlestick charts are the most popular and informative chart type for crypto trading. They show open, close, high, and low prices in a single visual element, making it easy to identify patterns and momentum.
What timeframe should beginners use?
Start with the 1-hour and 4-hour charts for active trading, and always check the daily chart for overall trend direction. Avoid 1-minute charts as a beginner because the noise-to-signal ratio is too high.
What is the most important indicator for crypto?
Volume is arguably the most important indicator because it confirms whether price movements are backed by real trading activity. A price breakout without volume is likely a fake-out.
How do I spot a fake breakout?
Fake breakouts typically show: low volume during the breakout, quick reversal back below the resistance level, and long wicks on the breakout candle. Wait for a candle to close above resistance before treating it as confirmed.
Can chart patterns predict crypto prices?
Chart patterns show probability, not certainty. A bullish pattern might work 60-65% of the time. This edge becomes profitable over many trades, but any single trade can go against you. Always use stop losses.
Where can I view crypto charts for free?
DEXTools offers free real-time charts for thousands of tokens across multiple blockchains, including all major technical indicators, drawing tools, and on-chain data overlays.
What is the difference between SMA and EMA?
SMA (Simple Moving Average) weighs all prices equally. EMA (Exponential Moving Average) gives more weight to recent prices, making it react faster to current price action. Most traders use EMA for short-term analysis and SMA for long-term trends.
