Bitcoin Weekly Analysis: First Bullish Candle Close Above $72K - Reversal or Fakeout? (March 16, 2026)
— By Tony Rabbit in Analysis

Bitcoin just closed its first bullish weekly candle above $72,000 in months, with RSI showing bullish divergence. But is this the start of a macro reversal - or just another fakeout? Here is a full technical breakdown.
Published: March 16, 2026 - This article is for informational and educational purposes only. It represents a technical view of the market and does not constitute financial advice, investment recommendations, or a solicitation to buy or sell any asset. Always do your own research (DYOR) and consult a qualified financial advisor before making investment decisions.
Bitcoin Closes First Bullish Weekly Candle Above $72K in Months
After weeks of relentless selling pressure, Bitcoin (BTC) has finally printed its first bullish weekly candle close above the $72,000 level - a development that has caught the attention of traders across the market.
As of Sunday's weekly close, BTC sits at approximately $72,451 on Bitstamp, marking a significant moment in an otherwise bearish market structure. But the key question remains: is this the beginning of a macro reversal, or just another fakeout?
The Bull Case: RSI Bullish Divergence
The most compelling argument for the bulls comes from the Weekly RSI (Relative Strength Index).
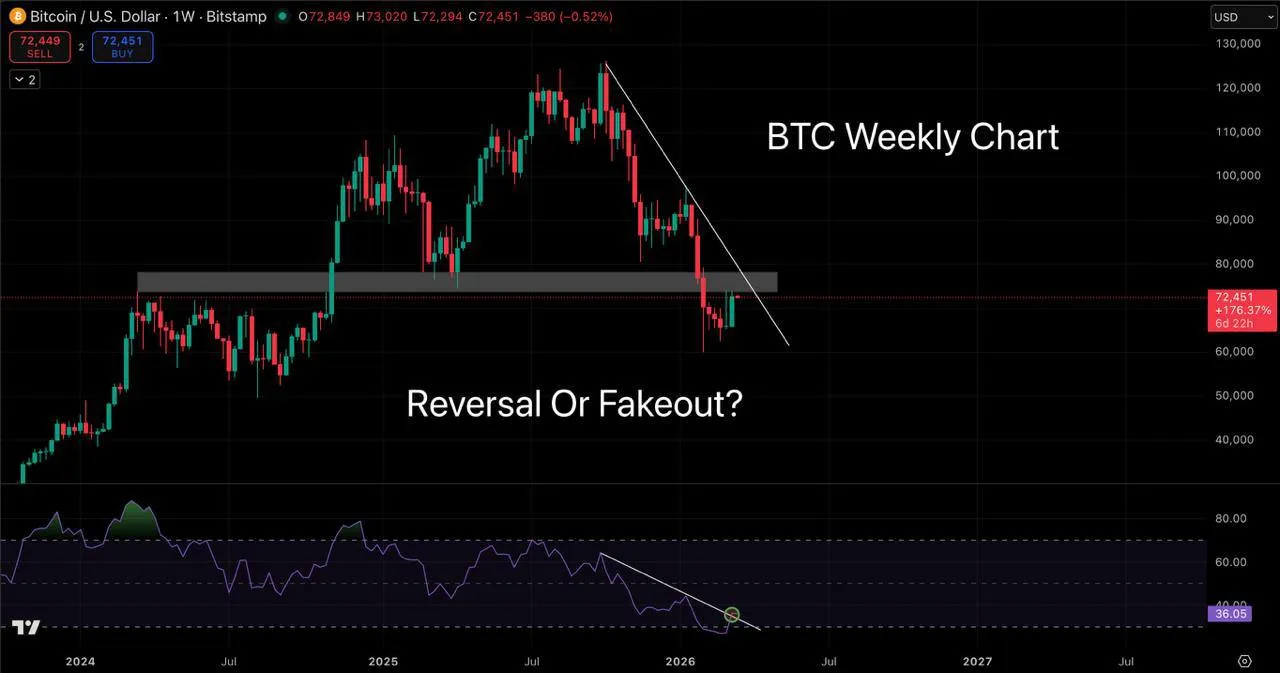
Looking at the weekly RSI, we can observe underlying bullish divergence forming after the indicator broke out of its downtrend. In simple terms, while price was making lower lows, the RSI was making higher lows - a classic signal that selling momentum is weakening.
This is an objectively positive development for bulls. However, bullish divergence alone does not guarantee a reversal. It is one piece of a much larger puzzle.
The Three-Factor Framework: Strength, Structure, and Trend
To properly evaluate whether a macro reversal is forming, we need all three of these factors to align:
1. Strength (Momentum) - Leaning Bullish ✅
The weekly RSI divergence and the bullish candle close above $72K suggest that momentum is shifting. Buying pressure is starting to show up at these levels, which is a constructive sign. This factor is currently leaning bullish.
2. Structure - Still Bearish ❌
Bitcoin's price structure tells a different story. The major macro resistance zone sits between $74,000 and $78,000 - a range that acted as support during the 2025 bull market and has now flipped to resistance.
For the structure to turn bullish, we would need to see consecutive weekly candle closes above this $74K–$78K zone. Until that happens, the structure remains bearish, and any rally into this range could simply be a retest of resistance before another leg down.
3. Trend - Still Bearish ❌
The broader trend is clear: Bitcoin is still making lower highs and lower lows on the weekly timeframe. A single bullish candle does not change a multi-month downtrend. To see the trend start to flip, we would need BTC to break the pattern by printing a higher high above the last significant swing high.
Macro Headwinds: DXY and Stock Market
Beyond Bitcoin's own chart, the broader financial landscape is adding pressure:
- DXY (U.S. Dollar Index) breaking out - The dollar is strengthening, which historically has an inverse correlation with risk assets like Bitcoin. A rising DXY typically means capital is flowing into the dollar and away from speculative assets.
- Stock market under pressure - Equities are currently selling off amid uncertainty surrounding the conflict in the Middle East. When traditional markets are in risk-off mode, crypto tends to follow - especially Bitcoin, which has become increasingly correlated with the S&P 500 and Nasdaq.
These macro factors represent significant headwinds that Bitcoin would need to overcome to sustain any meaningful reversal.
Key Levels to Watch
Bottom Line
Bitcoin's first bullish weekly candle close above $72K is a welcome sign for the bulls, and the RSI divergence adds weight to the argument that selling momentum is fading. However, one bullish candle does not make a reversal.
With only one out of three reversal factors met (strength), while structure and trend remain bearish, the bias should still lean toward lower prices in the near term - until proven otherwise by weekly closes above the $74K–$78K resistance zone.
This is a situation that warrants close monitoring in the coming weeks. If Bitcoin can build on this momentum and start closing above the macro resistance, the narrative could shift dramatically. But until then, caution remains the prudent approach.
Track BTC price action, analyze on-chain data, and monitor key levels with DEXTools.
Related Articles
⚠️ Disclaimer: This article is a technical analysis of market conditions and is not financial advice. Cryptocurrency investments carry significant risk. Past performance is not indicative of future results. Never invest more than you can afford to lose.