Coinglass Tutorial 2026: Liquidations & OI Master Guide
— By Tony Rabbit in Tutorials
Master Coinglass for crypto market insights. Learn to use liquidations, funding rates, and open interest to gauge market health and leverage.
To use CoinGlass effectively, you must understand its core function as a market context engine, not a price chart replacement. It provides crucial insights into the derivatives layer of crypto markets, focusing on liquidations, funding rates, and open interest. These metrics reveal underlying leverage, trader positioning, and potential market turning points, helping you identify whether price moves are sustainable or vulnerable to forced unwinds. By integrating CoinGlass data with your technical analysis, you gain a deeper understanding of market sentiment and the structural health of a trend.
What is CoinGlass and Why Does it Matter in 2026?
CoinGlass is a powerful analytics platform that provides deep insights into the cryptocurrency derivatives market. In 2026, where crypto markets are increasingly sophisticated and intertwined with traditional finance, understanding the derivatives layer is more critical than ever. While price charts show 'what' happened, CoinGlass helps explain 'why' it happened by revealing the underlying leverage, sentiment, and positioning of market participants. It's not a trading signal generator, but a market context engine that helps you assess the health and stability of price movements.
The Core Pillars: Liquidations, Funding Rates, and Open Interest
CoinGlass focuses on three primary metrics that are indispensable for derivatives traders:
- Liquidations: Forced closure of leveraged positions due to insufficient margin.
- Funding Rates: Periodic payments between long and short perpetual contract holders to keep the contract price pegged to the spot price.
- Open Interest (OI): The total number of outstanding derivatives contracts that have not been closed or delivered.
These three signals often explain why markets squeeze, chop, reverse, or suddenly accelerate, providing a crucial edge in understanding market dynamics.
Mastering Liquidations: The Market's Pain Points
Liquidations are one of the clearest indicators of market stress and forced positioning. When a large number of long positions are liquidated, it signifies that overconfident bulls were caught off guard by a price drop, leading to cascading sell pressure. Conversely, a wave of short liquidations indicates a rapid price increase that squeezed bears out of their positions. Analyzing liquidation clusters can help identify potential exhaustion points, trap moves, and panic conditions.
Key insights from liquidations:
- Exhaustion: A large liquidation spike into a major support or resistance level can signal that the flush is near exhaustion, potentially setting up a reversal.
- Crowded Leverage: If liquidations occur but Open Interest remains high, it suggests that despite the flush, significant leverage still exists in the market.
- Trend Continuation: If a squeeze clears one side of the market and funding rates normalize, it can make trend continuation more credible as excessive leverage has been removed.
Decoding Funding Rates: Gauging Market Sentiment
Funding rates are a powerful sentiment indicator. Positive funding means longs are paying shorts, indicating a bullish bias and often crowded long positioning. Negative funding means shorts are paying longs, signaling a bearish bias. The extreme nature of funding rates is what truly matters.
- Mild vs. Extreme: Mildly positive funding during a strong uptrend is normal. However, extremely positive funding after a fast breakout is a warning sign that too many traders are already positioned on the long side, making the market vulnerable to a reversal or correction.
- Divergence: Watch for divergences between price and funding. If price is rising but funding is becoming less positive or even negative, it could indicate weakening bullish conviction.
Understanding Open Interest: The Fuel for Price Moves
Open Interest (OI) represents the total number of outstanding derivatives contracts. It's a measure of the total amount of money committed to the market. Its interaction with price action is crucial:
- Rising OI with Rising Price: Often indicates new money entering the market to support the uptrend, suggesting strength and continuation.
- Falling OI with Rising Price: Can indicate a short squeeze where shorts are covering their positions, rather than new long demand. This can be less sustainable.
- Rising OI with Falling Price: Can indicate new short selling or increasing bearish conviction, suggesting further downside.
- Falling OI with Falling Price: Often indicates long liquidations or longs closing positions, suggesting a potential capitulation or exhaustion of the downtrend.
How to Use CoinGlass: A Step-by-Step Guide for 2026
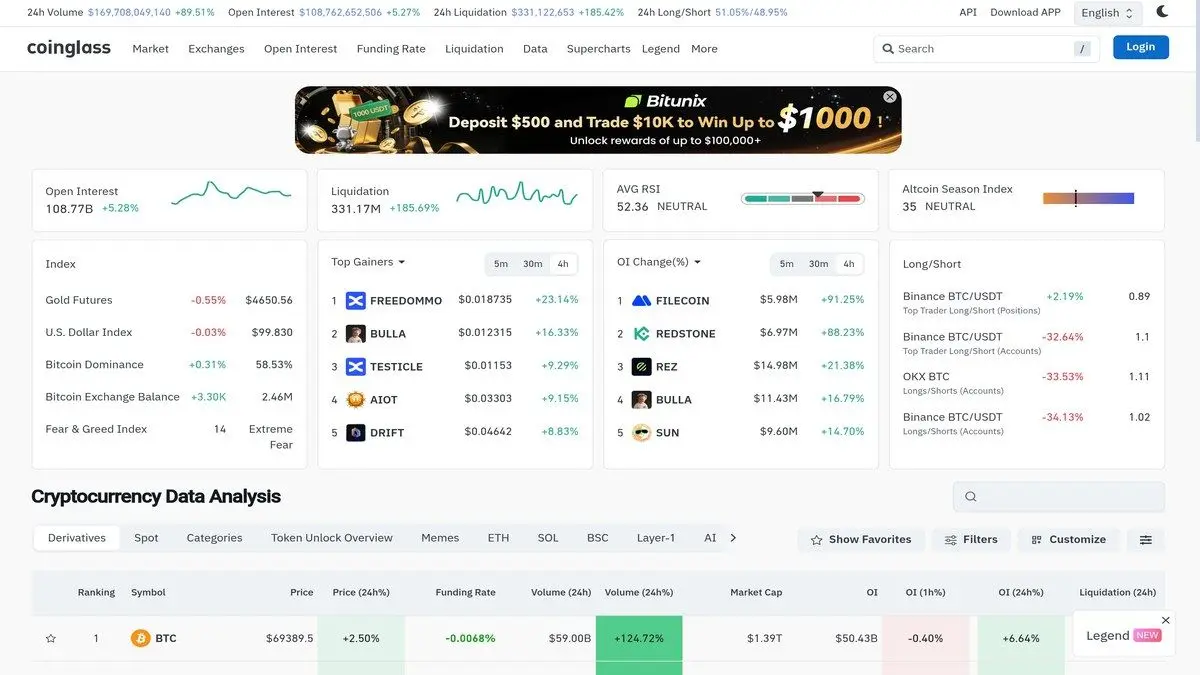
- Access the Platform. Navigate to CoinGlass.com. While a free tier offers significant data, consider a Pro subscription for real-time, in-depth, and historical data access, which is crucial for advanced analysis in 2026.
- Select Your Asset. Use the search bar or navigation menu to select the cryptocurrency pair you want to analyze (e.g., BTCUSDT, ETHUSDT).
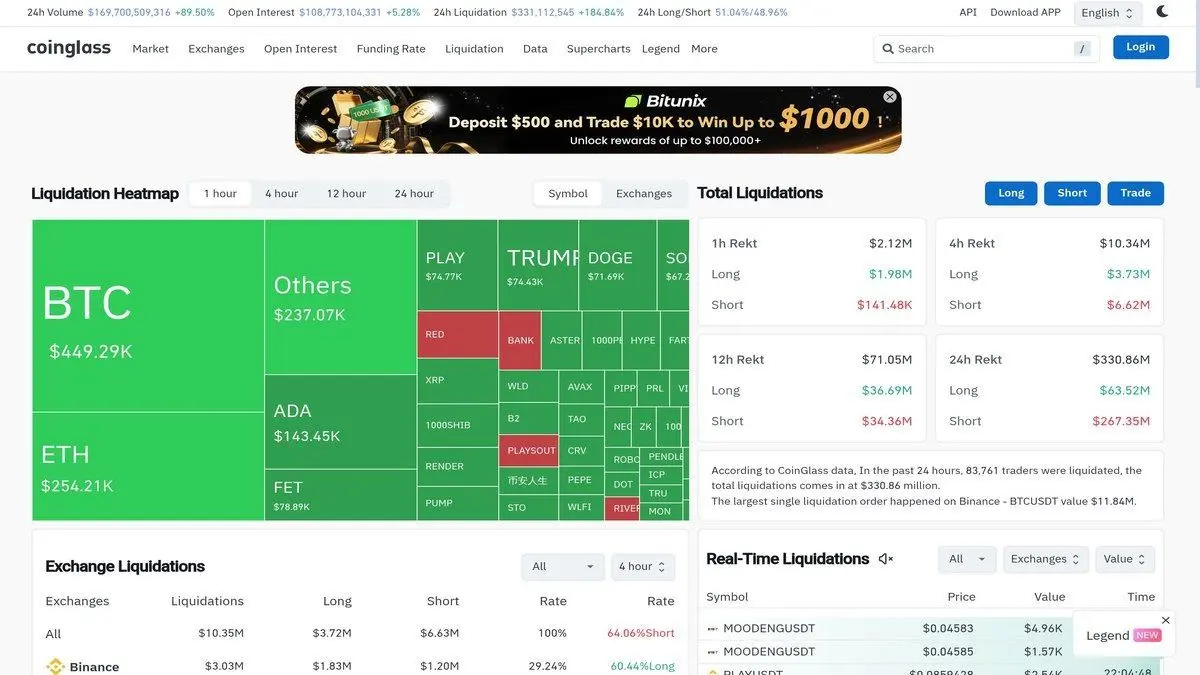
- Start with Liquidations. Go to the 'Liquidations' section. Observe the real-time liquidation heatmap and historical liquidation charts. Identify clusters of long or short liquidations. Are they occurring at key support/resistance levels? How large are they relative to recent price action?
- Analyze Funding Rates. Move to the 'Funding Rate' section. Examine the aggregated funding rates across major exchanges. Note if funding is extremely positive or negative. Compare current rates to historical averages for the asset.
- Monitor Open Interest. Check the 'Open Interest' charts. Observe the trend of OI in conjunction with price. Is OI expanding or contracting? How does it correlate with recent price moves?
- Combine the Data. Synthesize the information. For example, if price is rising, but OI is decreasing and funding rates are becoming less positive, it might signal a weakening trend despite rising prices. If a price drop is accompanied by a large long liquidation spike, but OI remains high, it suggests underlying leverage persists.
- Utilize Heatmaps and Aggregates. Explore the liquidation heatmaps to visualize price levels where large liquidations are concentrated. Use aggregated data across exchanges for a holistic market view, rather than focusing on a single exchange.
- Set Alerts (Pro Feature). Configure alerts for significant changes in funding rates, large liquidation events, or sudden shifts in Open Interest to stay informed without constant monitoring.
- Integrate with Your Charts. Always view CoinGlass data alongside your technical analysis charts. The derivatives data provides context to the price action you see.
CoinGlass vs. Price Charts: A Synergistic Approach
It's crucial to understand that CoinGlass is not a replacement for price charts but a complementary tool. Price tells you 'what' happened; CoinGlass helps explain 'why' it happened and whether the underlying structure can support the move. Integrating both provides a 360-degree view of the market.
Advanced CoinGlass Strategies for 2026
- Liquidation Heatmaps: Identify price levels with significant liquidation clusters. These can act as magnets or strong resistance/support levels where price might be drawn to clear out leverage.
- OI Delta: Look at the change in Open Interest over specific timeframes. A rapid increase in OI during a price rally suggests strong conviction, while a rapid decrease might signal profit-taking or capitulation.
- Exchange-Specific Data: While aggregated data is useful, sometimes a specific exchange shows extreme funding or OI, indicating localized leverage that could impact global price action.
- Long/Short Ratio: Observe the ratio of long to short positions. An extreme imbalance often precedes a squeeze in the opposite direction.
Risks and Limitations of CoinGlass Data
How DEXTools Helps Complement CoinGlass Insights
While CoinGlass excels at derivatives market context, platforms like DEXTools provide crucial real-time spot market data, especially for decentralized exchanges (DEXs). By combining CoinGlass's macro derivatives overview with DEXTools' granular, real-time DEX insights (e.g., liquidity, tokenomics, trading volume on specific pairs), traders gain a more complete picture. CoinGlass tells you if the overall market is overleveraged; DEXTools tells you if a specific altcoin on a DEX has healthy liquidity and genuine spot demand, helping you confirm if a derivatives-driven move has actual underlying support.
Conclusion: Your 2026 Guide to Market Context
In 2026, navigating the crypto market without understanding its derivatives layer is akin to driving blind. CoinGlass offers an unparalleled view into the forces of leverage, sentiment, and positioning that drive significant price movements. By diligently analyzing liquidations, funding rates, and open interest, and integrating these insights with your existing technical analysis, you can develop a more robust understanding of market health, anticipate potential reversals or accelerations, and ultimately make more informed trading decisions. It's about seeing the full picture, not just the price.
Frequently Asked Questions
What is CoinGlass?
CoinGlass is a cryptocurrency data and analytics platform.
How do I access CoinGlass?
You can access CoinGlass through its website or mobile app.
What kind of data does CoinGlass provide?
CoinGlass provides real-time market data, on-chain metrics, and derivatives data.
Is CoinGlass free to use?
CoinGlass offers both free and premium subscription plans.
How do I create an account on CoinGlass?
You can create an account by registering with your email address or linking a crypto wallet.
Can I customize my CoinGlass dashboard?
Yes, CoinGlass allows users to customize their dashboards with preferred widgets and data points.
Does CoinGlass offer trading tools?
CoinGlass primarily focuses on data analysis and does not directly offer trading functionalities.
How can I get support for CoinGlass?
CoinGlass provides customer support through its website, email, and social media channels.