Markets Bleed as Rate Hike Fears Surge: Bitcoin, S&P 500 and Nasdaq All Under Pressure
— By Tony Rabbit in Analysis
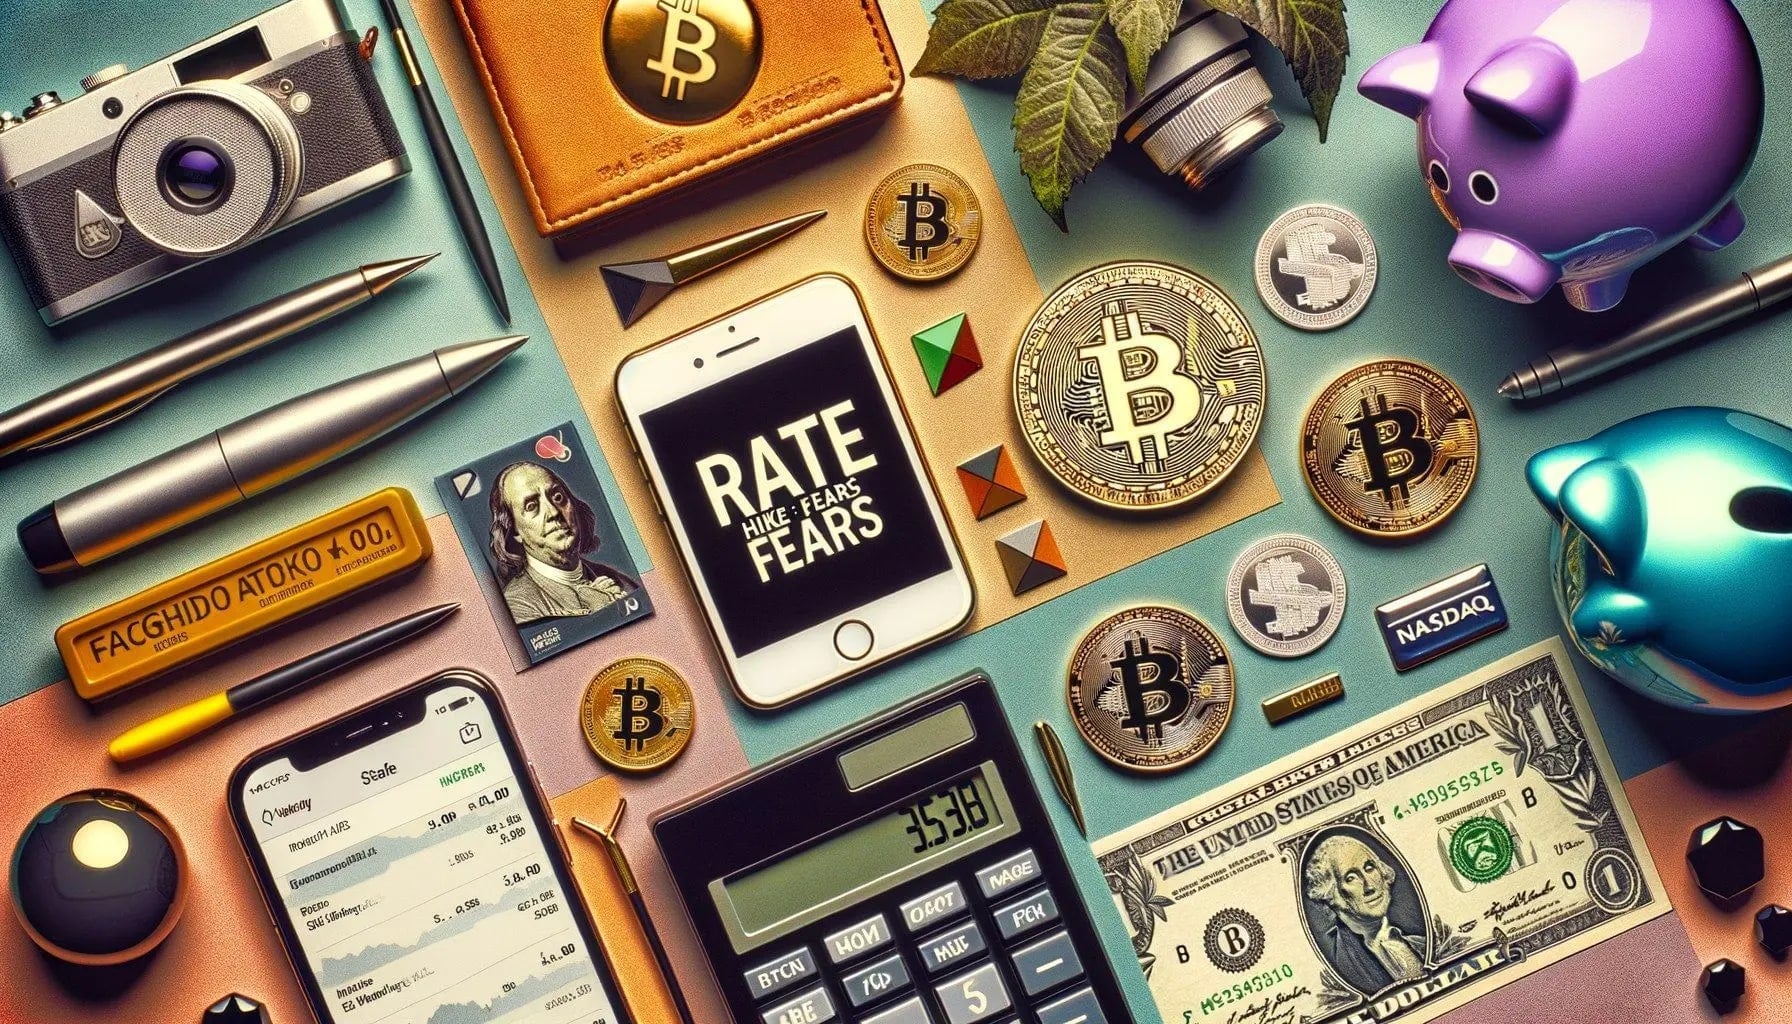
Financial markets took a beating on March 20 as rate hike fears surged, oil spiked 50%, and bonds sold off globally. The S&P 500 fell for a fourth straight week while Bitcoin derivatives signal growing caution.
Financial markets endured a brutal session on March 20, 2026, as a toxic combination of surging oil prices, escalating geopolitical tensions in the Middle East, and a sudden shift in Federal Reserve rate expectations sent shockwaves across every asset class. The S&P 500 dropped 0.9% on Friday — its fourth consecutive weekly decline — while the Nasdaq fell 1.2%. Bitcoin held near $70,500 but faces growing headwinds from the bond market meltdown.
The Catalyst: From Rate Cuts to Rate Hikes in Weeks
Just weeks ago, the consensus among traders was that the Federal Reserve would cut rates in April. That narrative has completely reversed. According to CME FedWatch, the probability of a rate hike at the April meeting has jumped to 12%, up from 0% just one week ago.
The culprits behind this dramatic shift are clear:
- Oil prices have surged 50% in three weeks since the Iran conflict escalated, with crude recently trading at $96 per barrel
- February inflation data showed headline CPI at 2.4% and core at 2.5% — both above the Fed's 2% target — and that was before the oil spike
- The U.S. economy shows only faint signs of slowing, giving the Fed little reason to ease policy
Bond Market in Turmoil
The long end of the yield curve is sending alarm signals. The 10-year U.S. Treasury yield jumped another 10 basis points on Friday to 4.38%, up from under 4% at the start of March. This represents one of the sharpest moves in recent memory.
The selloff is global. In the United Kingdom, 10-year gilt yields have broken above 5%, rising 15% in the past month and hitting their highest level since 2008. This kind of synchronized bond selling suggests a fundamental repricing of inflation expectations worldwide.
Equities: The Slow Bleed Continues
While there has been no single dramatic crash day, the cumulative damage to equities is mounting:
- S&P 500: Down 0.9% on Friday, now more than 5% lower since late February, marking its fourth straight weekly decline
- Nasdaq: Fell 1.2% on Friday, with tech stocks particularly vulnerable to rising rates
- Nasdaq 100 and S&P 500 futures continued to slide during Asian hours, dropping 0.6% and 0.4% respectively
The selling in equities has been orderly but relentless. No panic capitulation, just a persistent, grinding repricing of risk as the market adjusts to a world where rates may go higher, not lower.
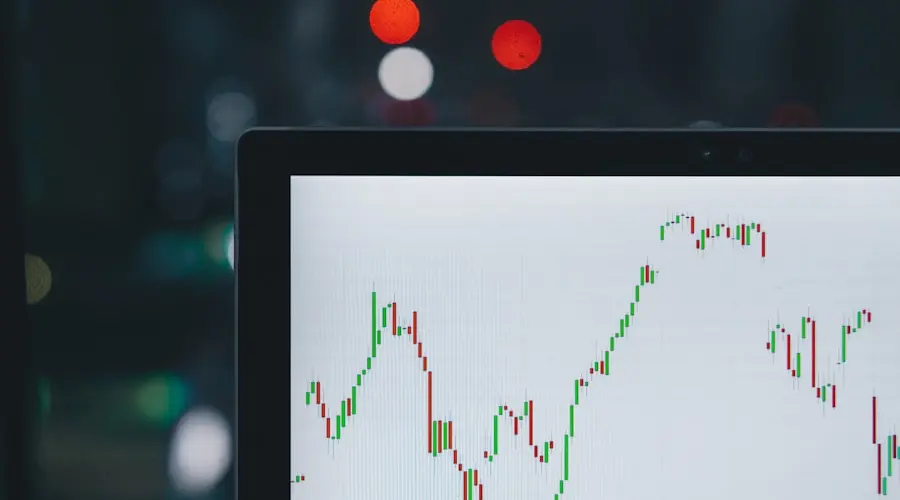
Bitcoin: Canary in the Coal Mine?
Bitcoin has been trading in a tight range around $70,000–$70,800, and while it hasn't collapsed, the derivatives market is flashing warning signs:
- Options skew has shifted defensive: The 24-hour call-to-put volume split moved to 43/56, heavily favoring puts
- The one-week 25-delta skew rose to 14% from 9%, meaning downside protection is getting significantly more expensive
- $308 million in 24-hour liquidations, with a 63/37 split between longs and shorts — longs are getting punished
- Funding rates have normalized, but the three-month annualized basis sits at just 2.8%, showing institutional caution
- Implied volatility term structure has flipped into backwardation — traders are bracing for an imminent high-impact event
"Bitcoin has once again acted as the canary in the macro coal mine," said Andre Dragosch, European Head of Research at Bitwise. "At current levels, bitcoin is already pricing a recession, while many traditional assets are not."
Gold and Silver: Safe Havens Crumble
In a counterintuitive move, traditional safe-haven assets have also sold off sharply since the Iran war began:
- Gold: Dropped from $5,500 per ounce at the start of March to $4,569 — a decline of nearly 17%
- Silver: Collapsed from $95 to $69.50 per ounce — down 27%
This decline in precious metals, which typically rally during geopolitical crises, suggests that forced selling and margin calls are overwhelming the safe-haven bid. When everything correlates to the downside, it's often a sign of systemic deleveraging.

Technical Pattern Raises Alarm
Adding to the concern, Bitcoin's current price action mirrors a dangerous technical pattern. According to analysts, BTC is forming a counter-trend recovery channel strikingly similar to the November–January pattern that preceded the devastating crash from $90,000 to $60,000 in early February.
The key level to watch is $65,800. A break below the lower trendline of the current channel could signal a return of full bearish control and potentially trigger another leg down.
What Comes Next
Markets are at a critical inflection point. The key factors to monitor in the coming days:
- Oil prices: Reports suggest the U.S. is weighing releasing sanctioned Iranian crude to increase supply. Any relief here could spark a bounce
- Fed commentary: Any official pushback against rate hike expectations could calm bond markets
- Bitcoin's $65,800 support: This is the line in the sand for bulls
- Quarterly options expiry: Quadruple witching could amplify volatility in the near term
For now, the message from markets is clear: the era of easy monetary policy expectations is over, and assets across the board are repricing for a harder reality.